
Figures & data
Table 1 MLST typing, biofilm formation, and virulence factors genes of 44 S. aureus isolations from SSTI patients
Figure 1 Neighbor-Joining tree of ST22 S. aureus isolates. The tree was rooted by the representative reference genomes of ST22 EMRSA-15 (HO 5096 0412 and H-EMRSA-15). The optimal tree with the sum of branch length =0.00212286 is shown. The tree is drawn to scale, with branch lengths in the same units as those of the evolutionary distances used to infer the phylogenetic tree. The evolutionary distances were computed using the Maximum Composite Likelihood method and are in the units of the number of base substitutions per site. Evolutionary analyses were conducted in MEGA X.
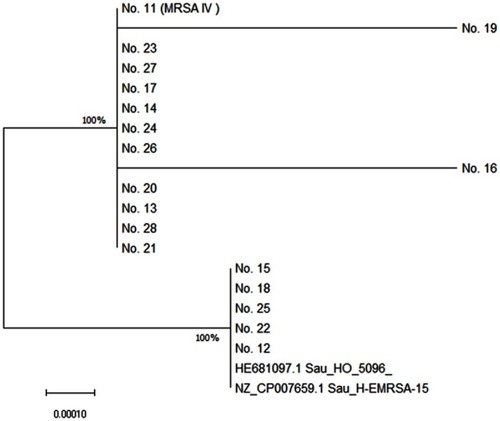
Table 2 Biofilm formation ability of MSSA and MRSA
Table 3 The sensitivities of antibiotics between weak biofilm and moderate biofilm producers among MSSA subgroup