Figures & data
Figure 4 Monthly distribution of viral pathogens by numbers of positive specimens.
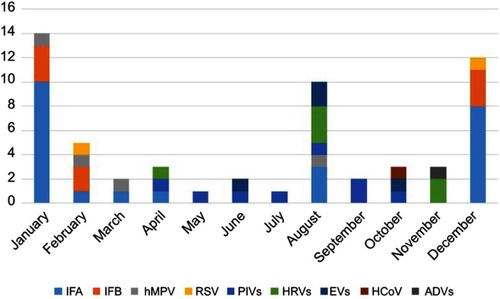
Table 1 The prevalence of the respiratory pathogens and the analysis grouped by age
Figure 1 Age distribution of respiratory pathogens profiles.
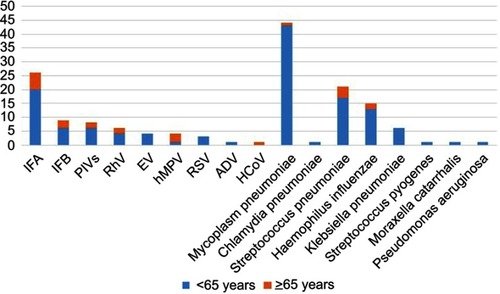
Table 2 The influence of specimen type in the positive specimens for the different pathogens
Figure 2 The polymicrobial infection of the pathogens by numbers of positive specimens. (A) mixed IFA and bacterial or atypical pathogens. (B) mixed RhV and bacterial or atypical pathogens. (C) other virus mixed with single bacterial or atypical pathogens. (D) mixed Mycoplasm pneumoniae and bacterial pathogens. (E) multiple bacterial pathogens. (F) multiple viral pathogen.
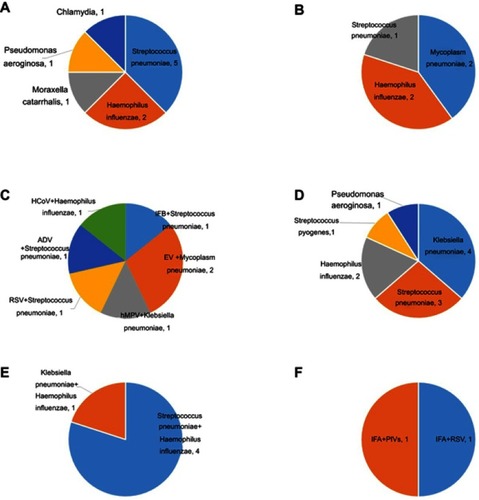
Figure 3 Monthly distribution of Mycoplasma pneumoniae by numbers of positive specimens.
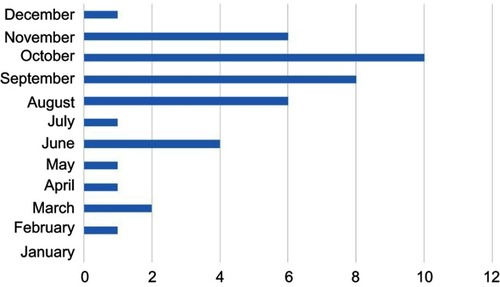
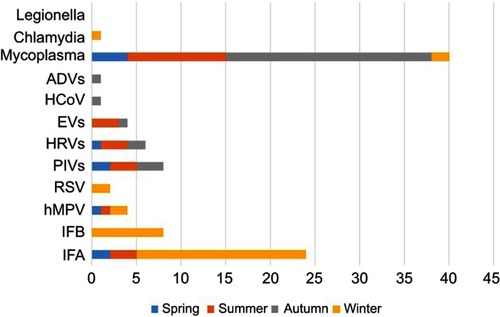
Figure 5 Seasonal distribution of viral and atypical pathogens by numbers of positive specimens.