Figures & data
Figure 1 PCA scores plot of bacterial isolates (Escherichia coli, Staphylococcus aureus, and Pseudomonas aeruginosa) after 15 hrs of inoculation, showing high discrimination index value of 83 between samples. PC1 and PC2 explain 84% of the total variation.
Abbreviation: PCA, Principal Component Analysis.
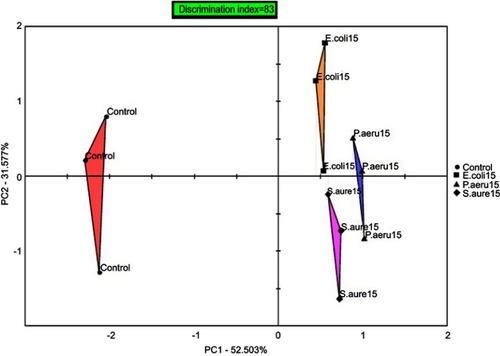
Figure 2 PCA scores plot of bacterial isolates (Escherichia coli, Staphylococcus aureus, and Pseudomonas aeruginosa) after 18 hrs of inoculation, showing high discrimination index value of 88 between samples. PC1 and PC2 explain 99% of the total variation.
Abbreviation: PCA, Principal Component Analysis.
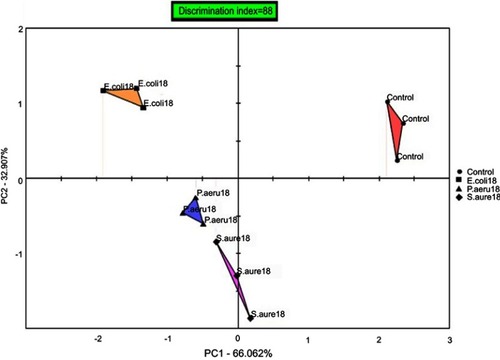
Figure 3 PCA scores plot of bacterial isolates (Escherichia coli, Staphylococcus aureus, and Pseudomonas aeruginosa) after 24 hrs of inoculation, showing high discrimination index value of 96 between samples. PC1 and PC2 explain 97% of the total variation.
Abbreviation: PCA, Principal Component Analysis.
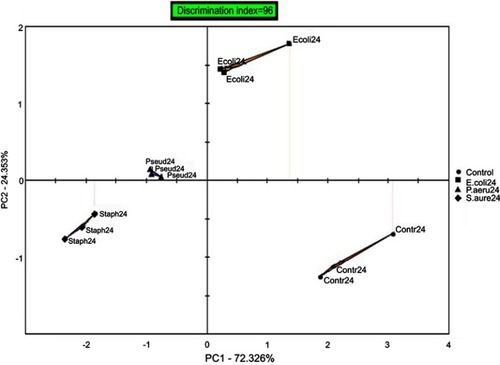
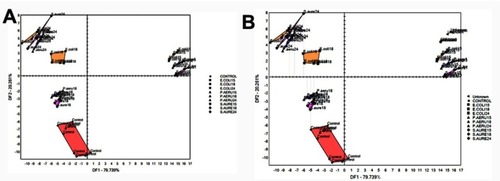
Figure 4 (A) DFA scores plot of bacterial isolates (Escherichia coli, Staphylococcus aureus, and Pseudomonas aeruginosa) after 15, 18, and 24 hrs of inoculation, (B) DFA model showing the projection and identification of unknown bacterial isolates near to E .coli. DF1 and DF2 explain 100% of the total variation.