Figures & data
Figure 1 Agarose gel (1%) electrophoresis showing the amplification of 16 S rDNA of representative presumptive bacteria isolates colonising the gut of chickens obtained from North-west province, South Africa.
Notes: Lane 1 to 29 shows the amplification of 16 S region of presumptive Salmonella DNA isolates while lanes 14 = no template (negative control), lane 13 = Salmonella Typhimurium ATCC 14028 (positive control).
Abbreviations: M, DNA marker (1kb); bp, base pairs.
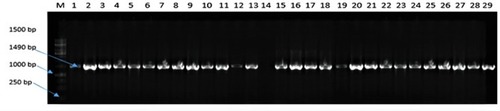
Table 1 Identity Of Presumptive Salmonella Isolates From Chickens In Mafikeng, South Africa
Figure 2 Agarose gel (1%) electrophoresis showing the amplification of invA gene in representative presumptive Salmonella isolates in chickens obtained from Mafikeng, North-west province, South Africa.
Notes: Lane 1 = no template (negative control), Lane 2 = Salmonella Typhimurium ATCC 14028TM (positive control); Lane 6 = Escherichia coli ATCC 259622TM (negative control), lane 2 to 18 = positive amplification of invA gene at 286 bp, lane 6 = no amplification.
Abbreviations: M, DNA marker (100 bp); bp, base pairs.
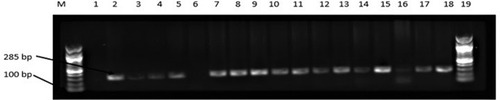
Figure 3 Percentage occurrence of Salmonella isolates based on its source.
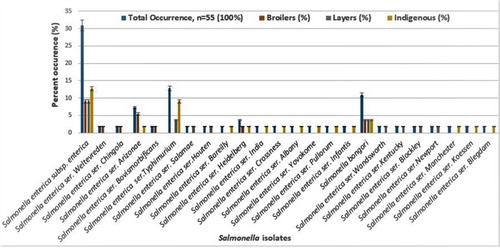
Figure 4 Neighbor joining method of phylogenetic tree based on partial 16S rDNA gene sequence, showing the phylogenetic relationships between Salmonella species and the most closely related strains from the genebank.
Notes: Numbers at the nodes indicate the ranks of bootstrap based on 1000 resampled data sets, and the cut-off points were placed at 70% for condensed tree. The scale bar indicates 0.5 base substitution per site. Salmonella enterica were set as the out-group. Sequences obtained in this study are denoted with a circle shape.
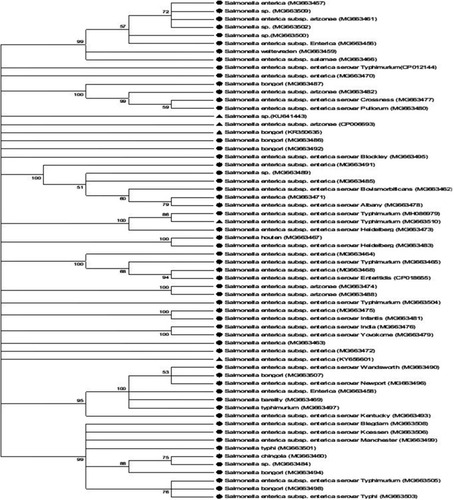
Table 2 Prevalence Of Antibiotic Resistance And Multi-Drug Resistance Of Salmonella Isolates From Chicken Sourced From Mafikeng, South Africa
Table 3 Multiple Antibiotic Resistance Index And Phenotype Pattern Of Salmonella Isolates From Chickens In Mafikeng, South Africa
Table 4 The Percent Distribution Of Resistant Salmonella Isolates Based On Sample Source And Antibiotic Resistant Clusters
Table 5 Pearson Correlations Between Percent Antibiotic Resistance Of Salmonella Isolates And Source
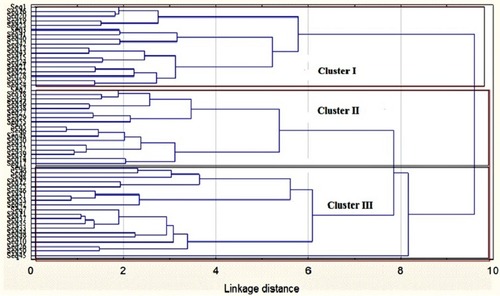
Figure 5 Dendrogram of antibiotic resistance profiles of Salmonella strains isolated from chickens in Mafikeng, South Africa, using cluster analysis.
Notes: Seq represents sequence numbering of Salmonella isolates from different types of chickens in Mafikeng. The tree was constructed using the Ward’s method and Euclidean distances in the Statistica version 7 software (Statsoft US).
Abbreviation: Seq, sequences of Salmonella isolates from chickens.