Figures & data
Table 1 Prevalence of naturally occurring NS3 RASs in 86 HCV subtypes
Table 1 (Continued).
Table 2 Prevalence of naturally occurring NS5A RASs in 86 HCV subtypes
Table 2 (Continued).
Table 3 Prevalence of naturally occurring NS5B RASs in 86 HCV subtypes
Table 3 (Continued).
Figure 1 The global and regional frequency of naturally occurring NS3 RASs that showed unequal distribution by geographic regions. In each plot, except for the first bar representing the global prevalence, geographic regions were arranged in descending order according to the frequency of RASs. Sequences were clustered into Asia, Europe, North America, Central America, South America, Former USSR, Oceania, Africa, Caribbean or Middle East. In each plot, regions with <10 sequences were not shown. Region definition was according to the Los Alamos HCV Database. “A” in North A, South A and Central A denotes America.
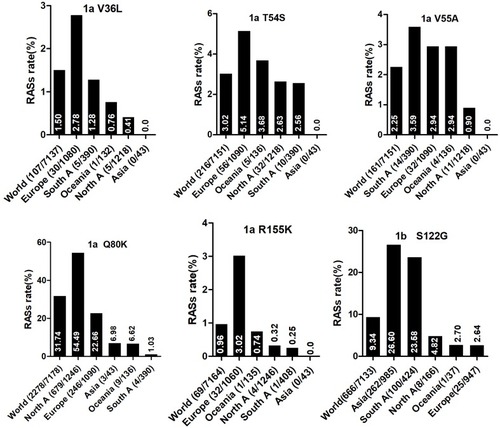
Figure 2 NS5A RASs rate with significantly different frequencies among different geographic regions. In each plot, the first bar represents the global prevalence and geographic regions were arranged in descending order according to the frequency of RASs. Sequences were clustered into Asia, Europe, North America, Central America, South America, Former USSR, Oceania, Africa, Caribbean or Middle East. In each plot, only regions with at least 10 sequences were shown. Region definition was according to the Los Alamos HCV Database. “A” in North A, South A and Central A denotes America.
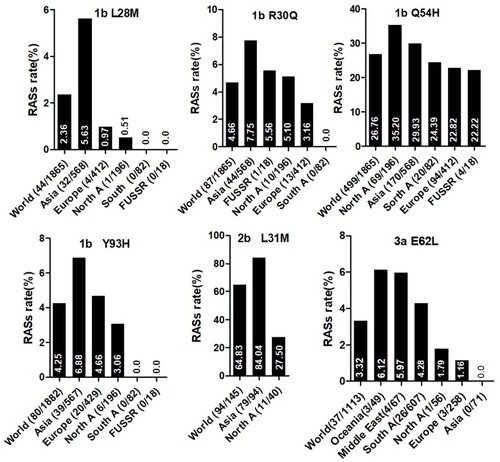
Figure 3 NS5B RASs rate with significantly different frequencies among different geographic regions. In each plot, the first bar represents the global prevalence and geographic regions were arranged in descending order according to the frequency of RASs. Sequences were clustered into Asia, Europe, North America, Central America, South America, Former USSR, Oceania, Africa, Caribbean or Middle East. In each plot, only regions with at least 10 sequences were shown. Region definition was according to the Los Alamos HCV Database. “A” in North A, South A and Central A denotes America.
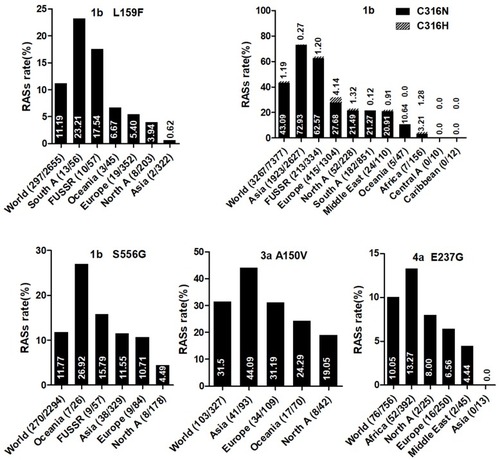
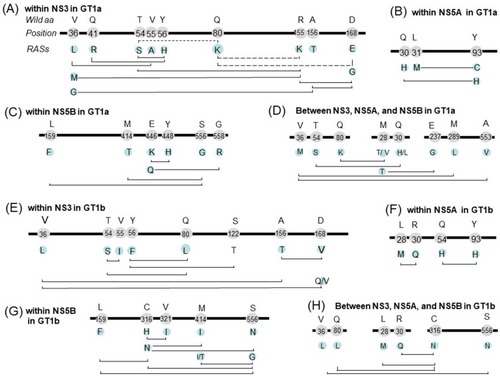
Figure 4 Co-occurring and mutually exclusive RAS pairs within NS3 (A), NS5A (B) and NS5B (C) and among regions (D) in GT1a; within NS3 (E), NS5A (F) and NS5B (G) and among regions (H) in GT-1b. Bold line represents HCV genome, the figures on the line indicate the location of amino acid, the characters above the location indicate the wild type amino acids, and the characters below the location indicate RASs. The solid, and dashed line connecting two RASs indicate co-occurring RAS pairs (significantly more frequent appearance than expected) and mutually exclusive RAS pairs (significantly infrequent occurrence than expected), respectively. Amino acid residue position is numbered relative to the first amino acid of the NS3, NS5A, or NS5B region.