Figures & data
Table 1 Primers Used In PCR Assay For 16s rRNA And Detection Of Aminoglycosides Resistance GenesCitation9,Citation12
Table 2 Distribution Of Enterococcus Species
Figure 1 Antibiotic resistance profile of E. faecalis and E. faecium.
Abbreviations: CN, gentamicin; S, streptomycin; AMP, ampicillin; VA, vancomycin; E, erythromycin; C, chloramphenicol; TE, tetracycline; LZD, linezolid.
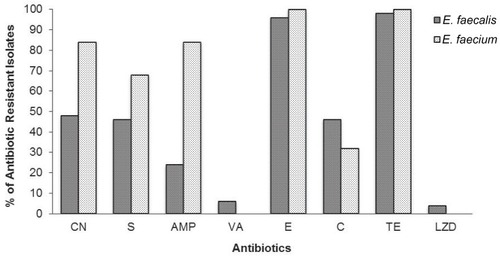
Table 3 Antimicrobial Patterns Of E. faecalis Isolates
Table 4 Antimicrobial Patterns Of E. faecium Isolates
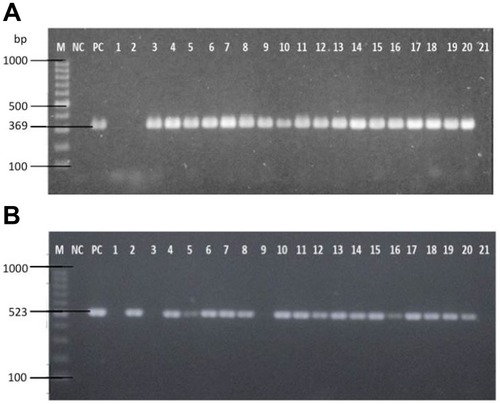
Figure 2 (A) Representative image of the amplified PCR products of HLGR gene, aac(6’)-Ie aph(2”)-Ia of Enterococcus isolates (expected size: 369 bp). (B) Representative image of the amplified PCR products of HLSR gene, aph(3’)-IIIa of Enterococcus isolates (expected size: 523 bp).
Abbreviations: Lane M, 100 bp ladder; NC, negative control (DNA-free template); PC, positive control (ATCC strain 51299); Lanes 1–21, Enterococcus isolates.