
Figures & data
Table 1 Prevalence Of Antimicrobial Resistance Genes In Shigella Spp. Isolated From Different Regions Of The World
Figure 1 Schematic representation of blaCTX-M-55, blaCTX-M-15, and blaTEM-1 genes in different types of plasmid. Arrows indicate positions and directions of different genes and IRL, terminal inverted repeats at the left, IRR, terminal inverted repeats at the right.
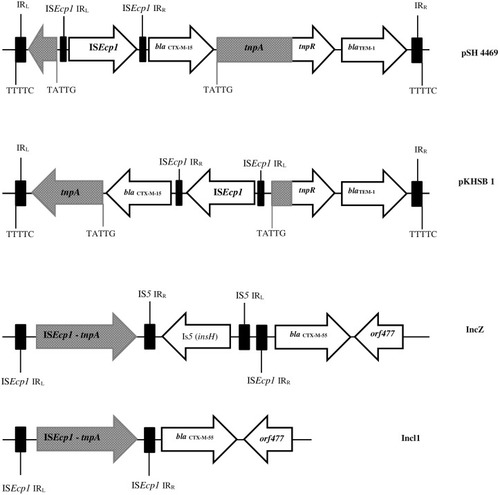
Figure 2 Physical map of Shigella atypical class 1 integron and locations of blaOXA-30 and aadA genes.
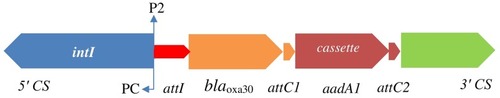
Table 2 Frequency Of Amino-Acid And Nucleotide Changes In The Quinolone Resistance–Determining Regions Of ShigellaIsolates In Different Parts Of The World
Figure 3 Structure of genes surrounding mcr-1 in S. flexneri.
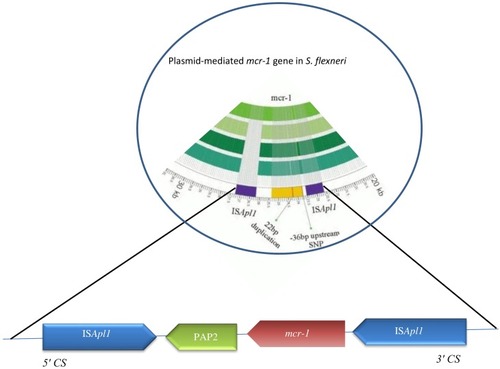
Figure 4 Variable regions of class 1 (A) and class 2 (B) integrons reported in different geographic area. Horizontal arrows indicate transcriptional orientation of genes.
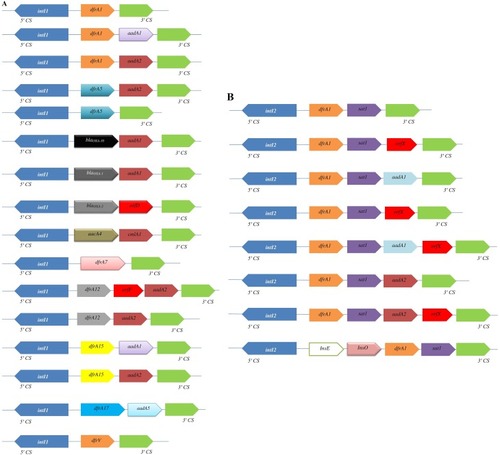
Table 3 Overview Of Shigella Vaccines In A Aifferent Phase