Figures & data
Figure 1 MICs were determined by agar dilution methods for all antibiotics except for colistin and tigecycline, for which broth microdilution was used. Results were interpreted using the CLSI guidelines. Pink indicates resistance, blue indicates mediation, and light yellow indicates sensitivity.
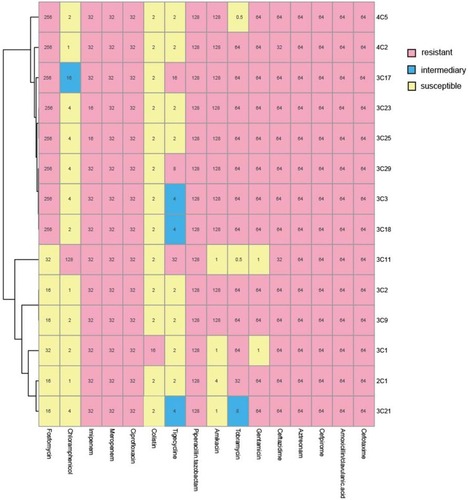
Table 1 Antibiotic Resistance Genes, STs, Plasmid Type And Plasmid Size Of KPC-Producing K. Pneumoniae Isolates
Figure 2 The genetic environment of the blaKPC-2 gene in K. pneumoniae was isolated from clinical sources. The arrows represent the direction of transcription. The red open reading frame (ORF) indicates the blaKPC-2 gene, the pink ORF indicates the mobile element, the yellow ORF indicates other resistance genes or enzymes and the gray ORF indicates other genes or genes of unknown function. (A) The genetic environment of blaKPC-2 is similar in isolates 2C1, 3C1, 3C2, 3C9, 3C17, 3C18, 3C29 and 4C5. (B) The isolates 3C3, 3C23 and 3C25 all carry blaKPC-2 and share the identical genetic environment surrounding the same gene. (C) The isolate 3C21 and the isolate 4C2 have the same genetic environment. (D) The genetic environment of the isolate 3C11 carrying the blaKPC-2 gene.
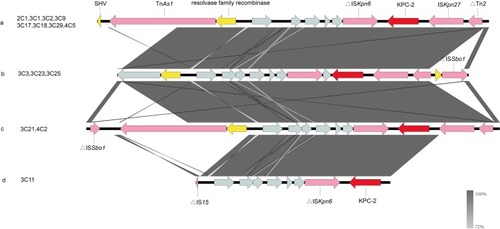
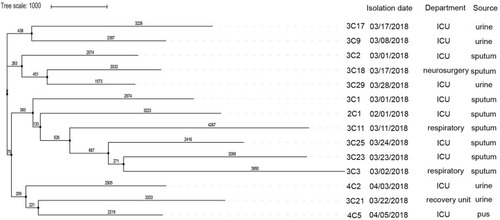
Figure 3 SNP analysis of KPC-2-producing K. pneumoniae isolates, performed using kSNP. The maximum likelihood analysis of the core SNP matrix output for kSNP is performed in iTOL.