Figures & data
Table 1 The Sequence Of Primers Of The Genes Used In This Study
Table 2 The Results From Phenotypic Drug Susceptibility Testing And Relevant drrA And drrB Gene Expression Fold Changes For MTB Isolates
Table 3 Correlation Of Genes Expression Fold Changes Of drrA And drrB In Mycobacterium Tuberculosis Isolates With Various Drug-Resistance Patterns
Figure 1 The drrA gene expression fold comparison of different groups of MTB isolates as per DST results.
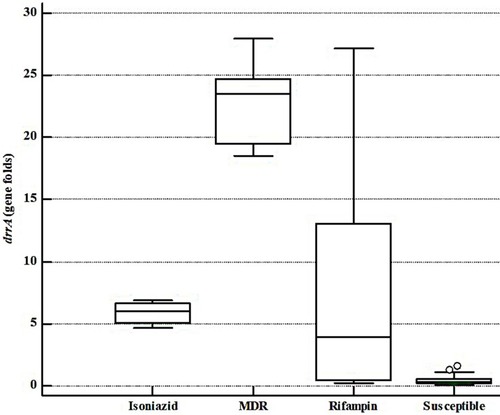
Figure 2 The drrB gene expression fold comparison of different groups of MTB isolates as per DST results. Note that a rifampin-resistant isolate showed very high levels of drrB gene expression which is shown by a dot on the FIGURE as an outlier.
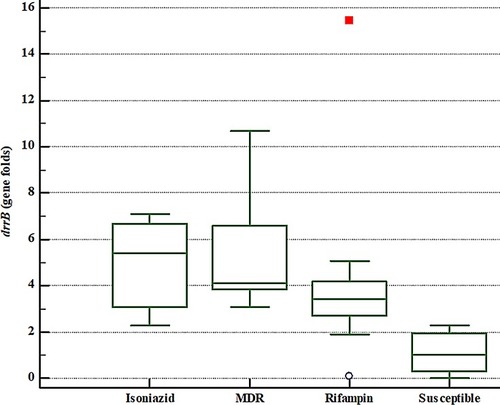
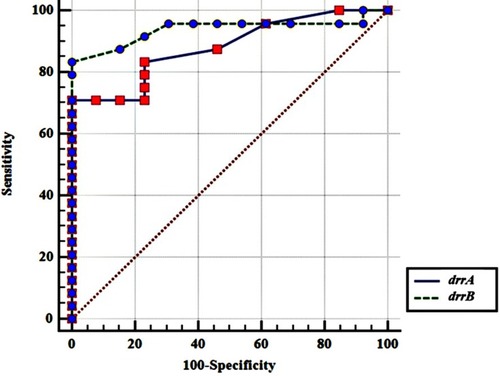
Figure 3 Comparative ROC curve for drrA and drrB genes. Statistical analysis showed that there is no meaningful difference between drrA and drrB genes considering diagnostic accuracy (P value= 0.4045).