Figures & data
Table 1 Comparison Of MTB Detection From Clinical Sputum Specimens By Using Culture, LPA, And GeneXpert Method
Table 2 The Mutation Of rpoB Gene Among RIF-Resistant Strains And Their MICs
Table 3 The Mutations Of KatG And inhA Among INH-Resistant Strains And Their MICs
Figure 1 Laboratory performance for each pulmonary sample.
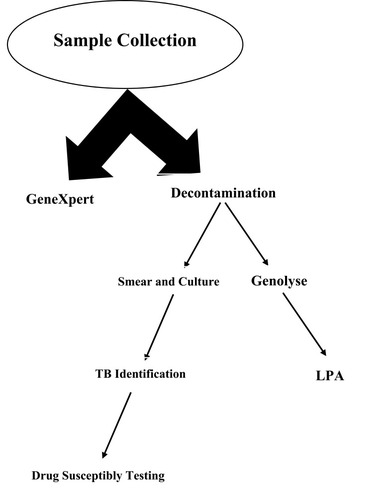
Figure 2 Banding patterns obtained by GenoType MTBDRplus VER 2.0 test. CC; conjugate control, AC; amplification control, TUB; M. tuberculosis complex-specific control, rpoB, katG and inhA; locus control zones specific for each gene. (Sample 8 is positive control of MTB (H37Rv), sample 2 have katG WT (wild type) and katG MUT1 bands which show S315T1 mutation in codon 315 of katG gene; Samples 1, 2, 5, 7, 10, 11, and 12 have inh WT1, 2 and inhA MUT1 bands which show A–16G mutation in inhA gene. Sample 2 has both KatG (S315T1) and inhA (A–16G) mutations simultaneously.
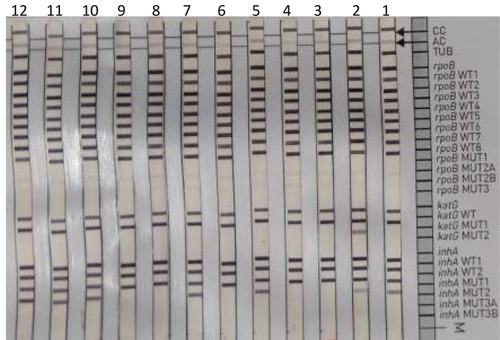
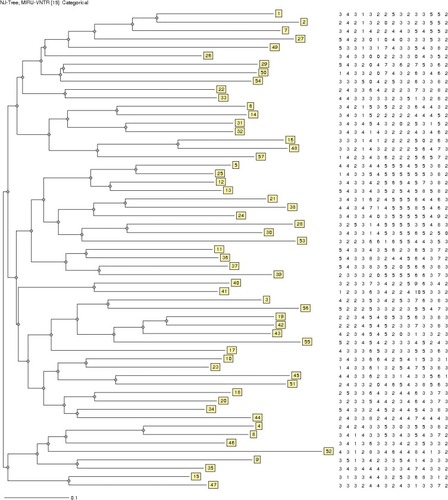
Figure 3 Genetic relatedness of 53 M. tuberculosis isolates by MIRU-VNTR genotyping (0.17 cut-off). Right hand: the allele number of 15 loci in MIRU-VNTR for each isolate. Isolate 1 is M. tuberculosis H37Rv.