
Figures & data
Table 1 List of Primers Used in This Study
Figure 1 Distribution of isolated Gram-negative pathogens from Shenzhen Children’s Hospital, China.
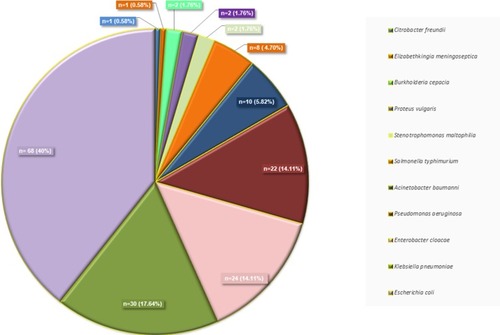
Table 2 Resistance Patterns of Gram-Negative Bacteria for Selected Antibiotics and Antibiotics Classes
Figure 2 (A) Number of isolates in which resistance is detected for each antibiotic. (B) Detection percentages of resistance to each antibiotic.
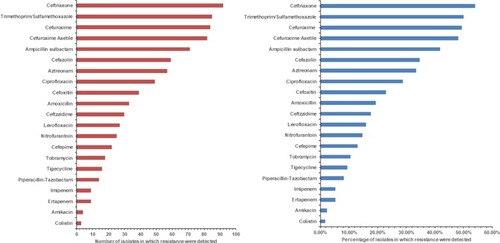
Table 3 Distribution of MDS, SDR, MDR, and XDR Pattern of Gram-Negative Bacteria
Table 4 Prevalence of Drug Resistance Determinant (Genes) in Isolated Gram-Negative Bacteria