Figures & data
Table 1 Patients’ Characteristics for the Groups According to CMV DNA Load
Table 2 Univariate Analysis of 3-Year Outcomes for the Groups According to CMV DNA Load
Table 3 Multivariate Analysis of 3-Year Outcomes in CR Patients
Figure 1 Cumulative incidence of relapse and NRM according to CMV DNA load in CR patients. (A) Relapse; (B) Non-relapse mortality.
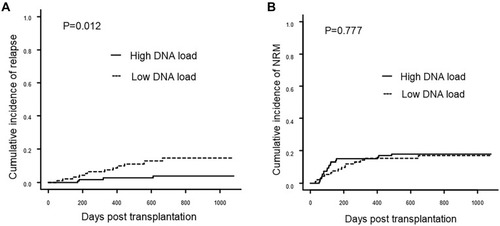
Figure 2 Probability of survival according to CMV DNA load in CR patients. (A) Disease-free survival; (B) Overall survival; (C) GVHD-free, relapse-free survival.
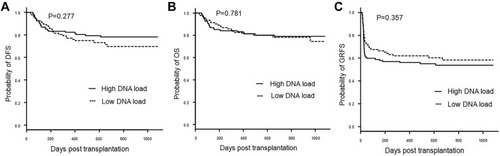
Figure 3 Lymphocytes reconstitution according to CMV DNA load in CR patients. (A) Absolute number of T cells; (B) Absolute number of NK cells; Notes: All of the statistical graphs show median±interquartile range. *P ≦ 0.05.
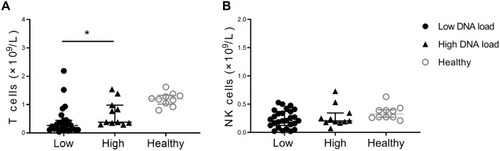
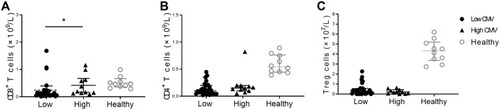
Figure 4 T cell subsets reconstitution according to CMV DNA load in CR patients. (A) Absolute number of CD8+ T cells; (B) Absolute number of CD4+ T cells; (C) Absolute number of Treg cells.
Notes: All of the statistical graphs show median±interquartile range. *P ≦ 0.05.