Figures & data
Figure 1 Identification of VVC C. albicans isolates.
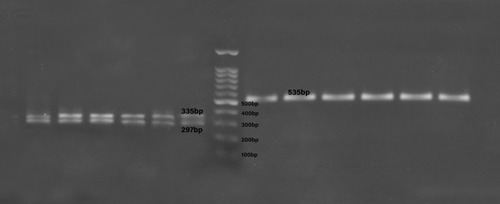
Table 1 The Specific Primer Sequences and PCR Product Length
Figure 2 Susceptibility pattern of C. albicans isolates to Fluconazole (25 µg) showing different sizes of inhibition zone: (A) 14 mm (R), and (B) 22mm (S).
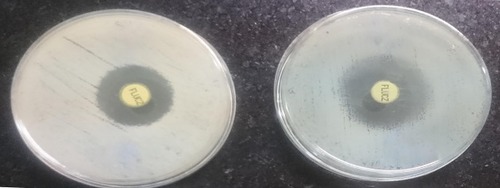
Figure 3 Agarose gel electrophoresis of the amplicon lane M: DNA marker, lane 1, positive control; (+) lane 6, negative control;(–) and lanes 2–4 visible amplification of ERG11 gene with a band size of 397 bp for Fluconazole-resistant C. albicans isolates.
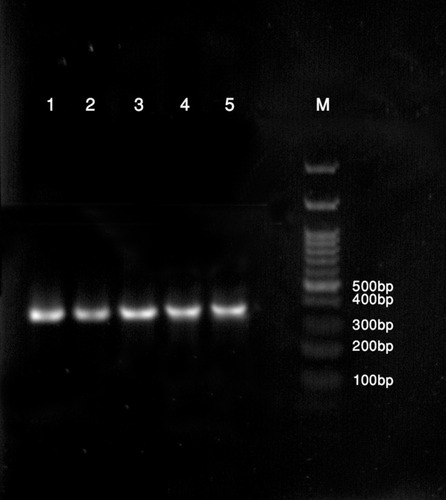
Table 2 In vitro Susceptibility Testing of VVC C. albicans Isolates Against ZnO Nanoparticles and Nystatin
Figure 4 The antifungal activity of ZnO nanoparticles and Nystatin on VVC C. albicans isolates: (A, B) MIC values of ZnO nanoparticles and Nystatin against C. albicans were determined by microdilution method. The isolates were incubated with various concentrations of ZnO nanoparticles and Nystatin for 24 hrs before conducting the MTT assay.
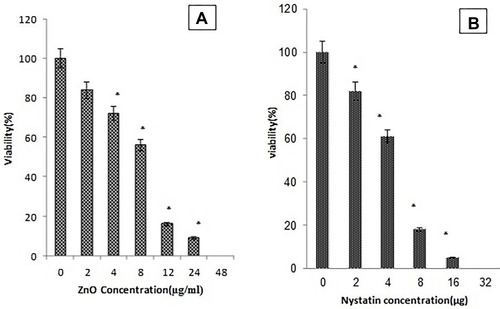
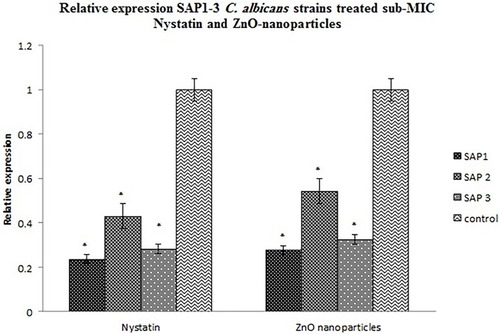
Table 3 SAP1-3 Genes Expression Level in Vulvovaginal C. albicans Isolates
Figure 5 Comparison of the expression of SAP1-3 of VVC C. albicans isolates with 3±1.7µg/mL concentrations of ZnO-nanoparticles and Nystatin compared to the calibrated gene in the control group (Value of the nonadjacent samples was zero). The ACT1 gene was used as an internal control (P<0.05). The numbers were obtained as mean ± standard deviation (SD) after three replicates.