Figures & data
Figure 1 Schematic representation of the probabilistic risk assessment framework used in this study: (A) problem formulation, (B) exposure/effect analyses, and (C) risk characterization (see text for the symbolic meaning).
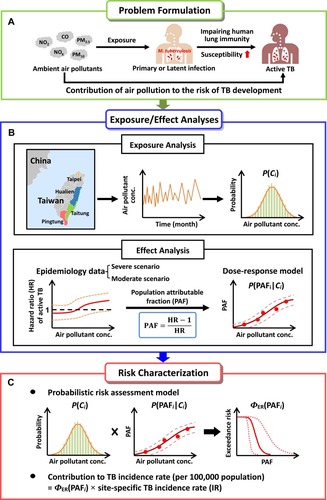
Figure 2 Probability distributions of concentrations of air pollutants for (A) NO2, (B) NOX, (C) CO, (D) PM2.5, and (E) PM10 in Taipei City, Hualien, Taitung, and Pingtung Counties, respectively.
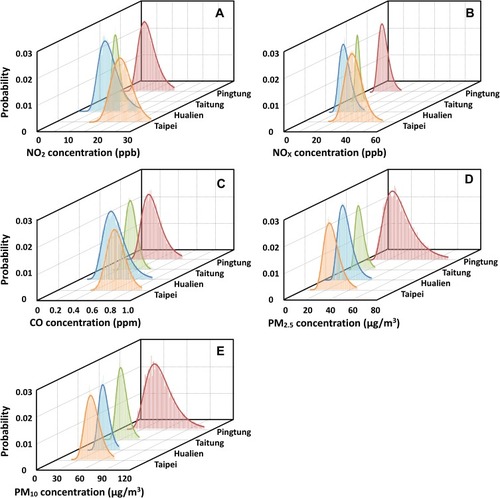
Table 1 Fitted Coefficients of Three-Parameter Hill Models for Describing the Relationships Between Air Pollutant Concentrations and Population Attributable Fraction (PAF) of Incident TB
Figure 3 Population dose–response profiles describing the relationship between air pollutant concentrations and population attributable fraction (PAF) of incident TB for (A–E) NO2, NOX, CO, PM2.5, and PM10 under the severe scenario; and for (F–H) NO2, NOX, and CO under the moderate scenario.
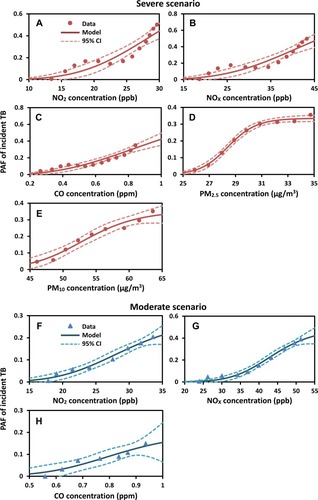
Table 2 Estimated the Highest Population Attributable Fraction (PAF) of TB Associated with Air Pollution Exposure at Exceedance Risk Probabilities of 0.8 (Most Likely) and 0.5 (likely) for Taipei City, Hualien, Taitung, and Pingtung, Respectively
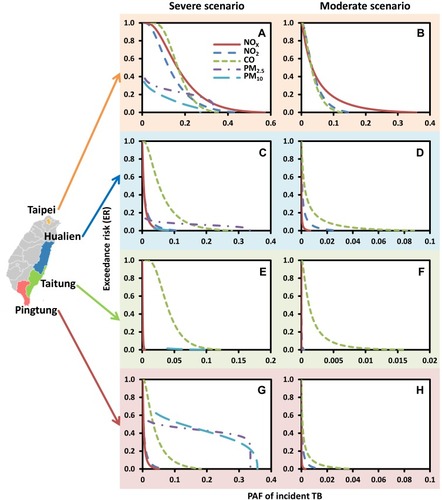
Figure 4 Population-level exceedance risk curve of air pollutants-associated population attributable fraction (PAF) of incident TB under severe and moderate scenarios for (A, B) Taipei City, (C, D) Hualien County, (E, F) Taitung County, and (G, H) Pingtung County, respectively.