Figures & data
Table 1 Primers Used In This Study
Figure 1 The PCR fragments for the knockout of the sag gene and the S. anginosus (ATCC33397/NCTC10713) growing on Blood Agar Plate (BAP). (A) The up+erm+down fragment after fusion PCR; (B) is the up+erm fragment and (C) is the erm+down fragment. (D) The sag fragment of ATCC33397 (WT); (E and F) are erm fragments; (G) is upstream and (H) is downstream of the sag coding area. (I) The sag fragment of the mutant amplified from Δsag ATCC33397 with primers sag-F-primer and sag-R-primer shown in . (J) The wild type, withαhaemolytic activity, and (K) is the mutant with no sag gene and no haemolytic activity.
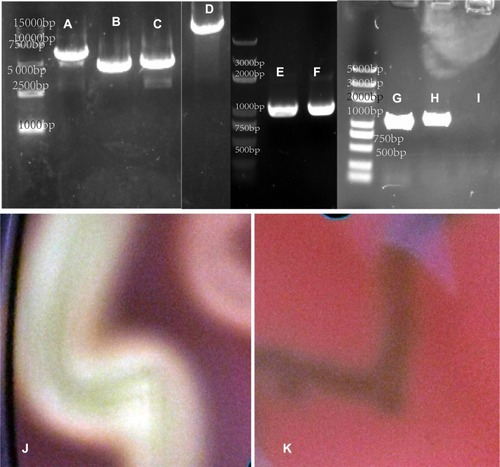
Table 2 The Symptoms Of Each Patient With AV. “1” Represents Yes, Meaning The Patient Had The Characteristic, And “0” Represents No
Figure 2 The clustering analysis of AV, BV and NM. The relevance of species to each sample is shown. The deeper the colour is, the more relevant the sample is to the species.
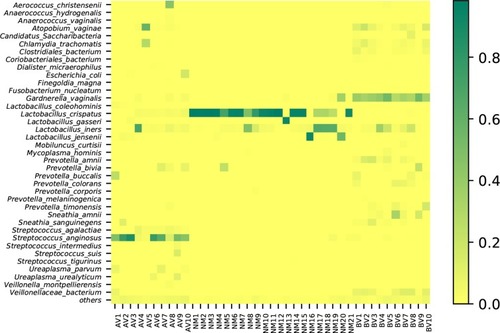
Figure 3 The dendrograms of AV, BV and NM samples. The dimensions of the tree show the distance of the samples.
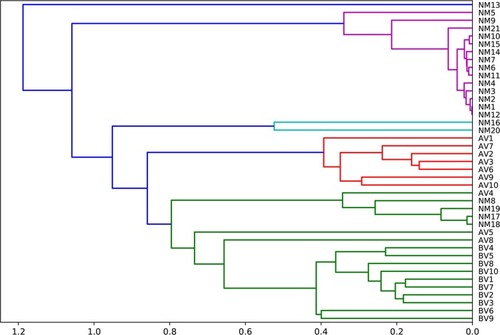
Figure 4 The average abundance of genera in AV, NM and BV samples. The total abundance of each group is 1.
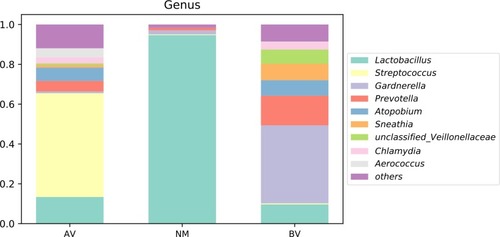
Figure 5 Comparison of the abundance of Streptococcus between AV, NM and BV samples. **p<0.01.
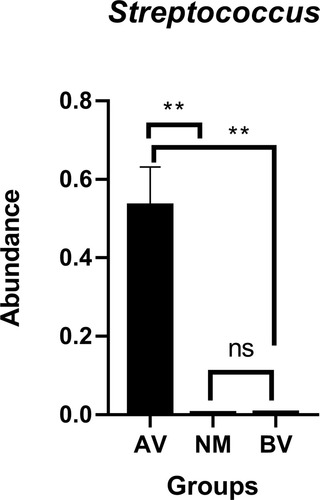
Figure 6 The average abundance of species in AV, NM and BV samples. The total abundance of each group is 1.
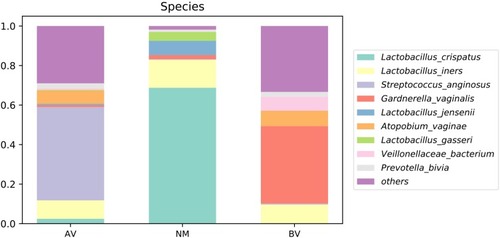
Figure 7 The average abundance of each species in the AV microbiome. S. anginosus was significantly more abundant than other species. **p<0.01.
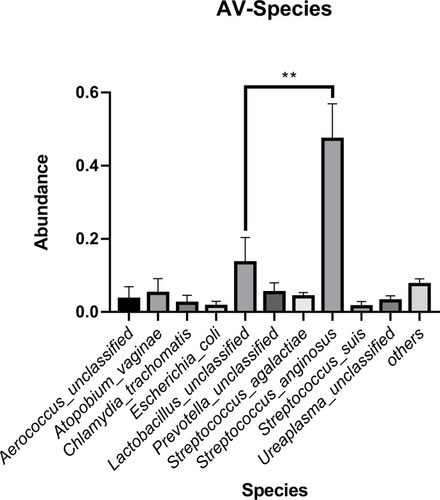
Figure 8 The growth curves of S. anginosus (ATCC33397) and the Δsag mutant.
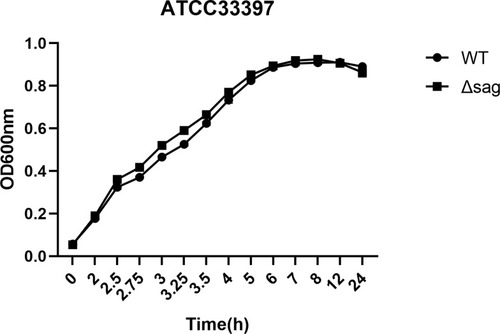
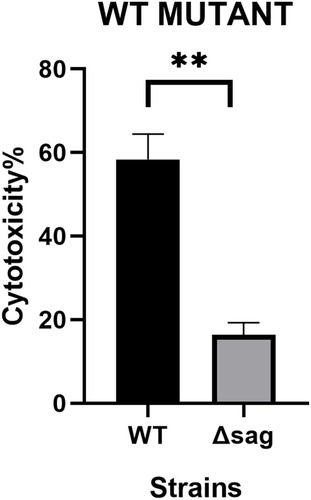
Figure 9 The cytotoxicity of S. anginosus (ATCC33397) and the Δsag mutant was significantly different. **p<0.01.