Figures & data
Table 1 Antimicrobial Drug Susceptibility Profiles
Table 2 Major Features of Plasmids Analyzed
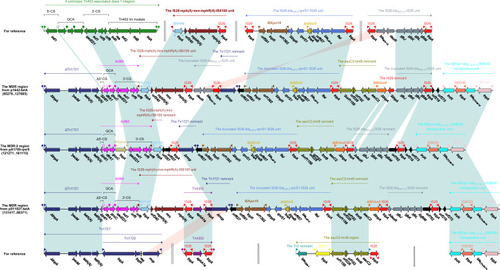
Figure 1 Linear comparison of the sequenced plasmid.
Notes: A linear comparison of the group of plasmids namely pKPN-c22, pKPSH11, p6234-198.371k, pKPN3-307_TypeC, pKPN3-307_typeA, pA1705-qnrS, p911021-tetA and p1642-tetA was performed containing the replication initiation genes repA and the repB1. Genes are indicated by arrows; genes, moving elements, and other regions are represented by different colors by function; shaded parts indicate regional nucleotide identity is greater than 95%.
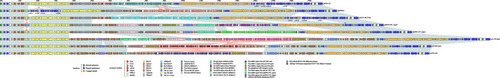
Table 3 Accessory Modules of Plasmids Analyzed
Table 4 Drug Resistance Genes in Plasmids Analyzed
Figure 2 Accessory modules of the MDR region from pKPN-c22, pKPSH11, p6234-198.371kb, pKPN3-307_TypeC, and pKPN13-307_typeA and the MDR-1 region from pA1705-qnrS.
Notes: Genes are indicated by arrows; genes, moving elements, and other regions are represented by different colors by function; shaded parts indicate regional nucleotide identity greater than 95%.
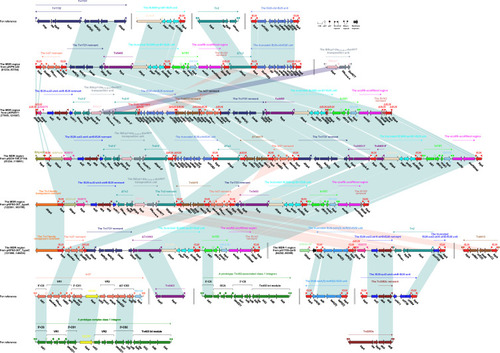
Figure 3 Accessory modules of the MDR region from p1642-tetA and p911021-tetA, and the MDR-2 region from pA1705-qnrS.
Notes: Genes are indicated by arrows; genes, moving elements, and other regions are represented by different colors by function; shaded parts indicate regional nucleotide identity is greater than 95%.