
Figures & data
Figure 1 Forest scatter plot showing the relationship between the different exposure and severe malaria. Event is the number of severe malaria patients in that group. The treatment group had exposure to the variable of interest, while the participants in the control group were not exposed. The weights depict how much each variable contributes to the overall exposures.
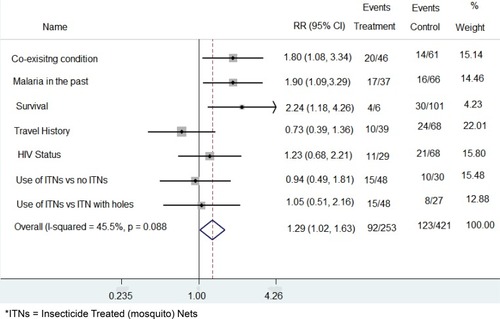
Table 1 Exposure and Outcome of the Study Participants Who Presented with Malaria in Relation to HIV Infection