Figures & data
Table 1 Oligonucleotide Primers Used for PCR Amplification
Figure 1 Distribution of P. mirabilis isolates according to the age and gender of UTI patients.
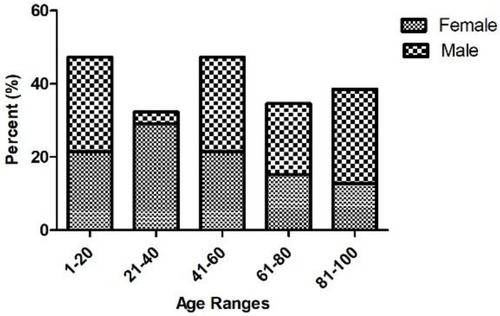
Table 2 Hemagglutination Patterns of the P. mirabilis Isolates
Table 3 Different Patterns of Antibiotic Resistance Among the Isolates
Table 4 Distribution of Antibiotic Resistance According to Inpatients and Outpatients
Table 5 Relationship Between Antimicrobial Resistance and Biofilm Formation in P. mirabilis Isolates
Table 6 Prevalence of Antimicrobial Resistance Among ESBL-Positive and ESBL-Negative Isolates
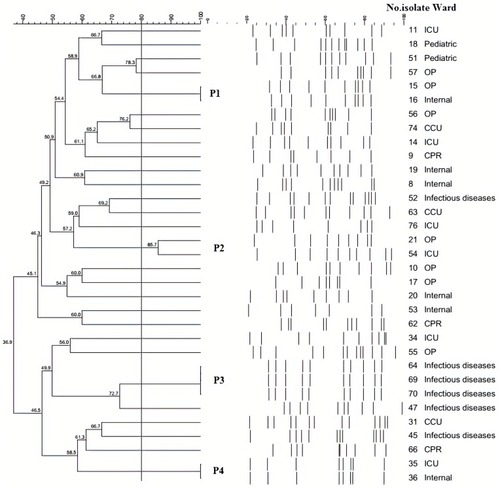
Figure 2 PFGE results of the selected P. mirabilis isolates. Dendrogram of PFGE was constructed based on UPGMA by using Dice coefficient with a 1.0% band position tolerance. The scores above the dendrogram show the percentage of similarity, and the solid line indicates 80% similarity.
Notes: P1-P4, Pulsotypes 1–4.