
Figures & data

Table 1 Primers and PCR Products of PZA-Associated Genes with Brief Explanatory Notes
Table 2 Prevalence of MDR, Pre-XDR and XDR TB in PZAR Strains
Table 3 Distribution of Beijing and Non-Beijing Genotypes
Table 4 Correlation of Genotypic Susceptibility Testing and PZase Activity Assay
Figure 1 Depiction of mutations in Rv2044c-pncA-Rv2042c operon in PZAR strains. *Indicates the mutations exist only in Rv2044c or upstream flanking region of pncAwt in PZAR M. tuberculosis strains. The remaining mutations in operon exist along with the mutation(s) in pncA coding region. # indicates the novel mutations. Small arrows near the dotted lines direct the forward and reverse primers used for amplification of required fragments. PZase activity is shown by letters; N (negative), P (positive), WP (weakly positive).
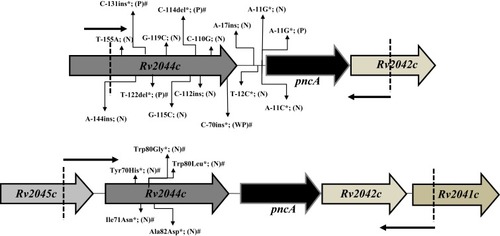
Table 5 Evaluation of Sequencing Method and Phenotypic Susceptibility Testing for Detection of PZA Resistance