
Figures & data
Table 1 PCR Primers Used For Construction In This Study
Table 2 MIC Values Of Various Types Of H. Pylori To Antimicrobial Agents
Figure 1 Growth curve of various types of H. pylori 11,637 with no drug or with drug.
Notes: (A) Growth curve without drug or with (B) AMO (0.064 µg/mL); (C) TET (0.125 µg/mL); and (D) CLA (0.125 µg/mL).
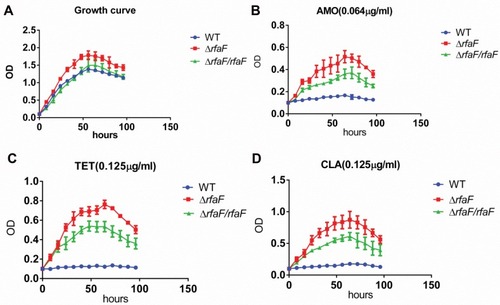
Figure 2 Comparison of EB accumulation in various types of H. pylori strains.
Notes: The data presented are the means ± standard errors of the means from three separate experiments. *P<0.05; **P<0.01.
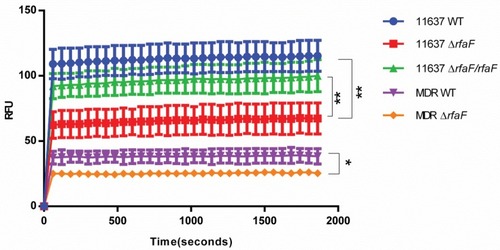
Table 3 rfaF Amino Acid Mutation Analysis