Figures & data
Table 1 The Diagnostic Criteria
Figure 1 The concentrations of IL-27 and ADA in BALFs of different groups.
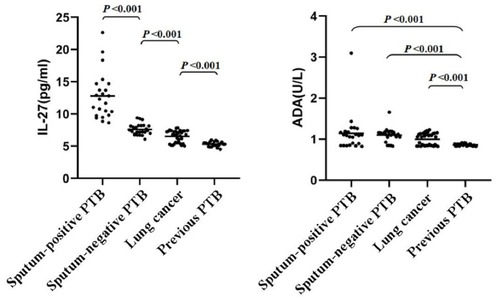
Table 2 The Concentrations of IL-27 and ADA in BALFs of Different Groups (Mean±SD)
Figure 2 ROC curve for differential diagnosing PTB from lung cancer.
Notes: PTB including sputum-negative PTB and sputum-positive PTB.
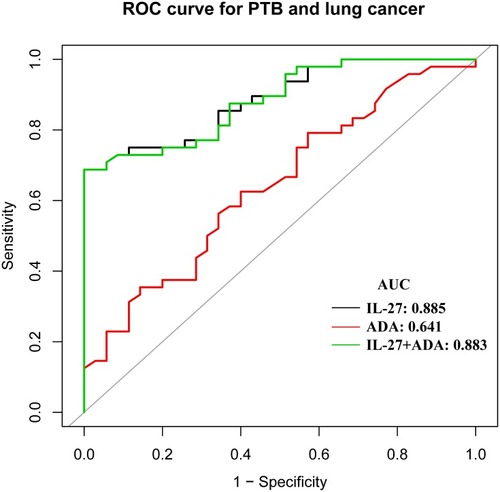
Figure 3 ROC curve for differential diagnosing PTB from previous PTB.
Notes: PTB including sputum-negative PTB and sputum-positive PTB.
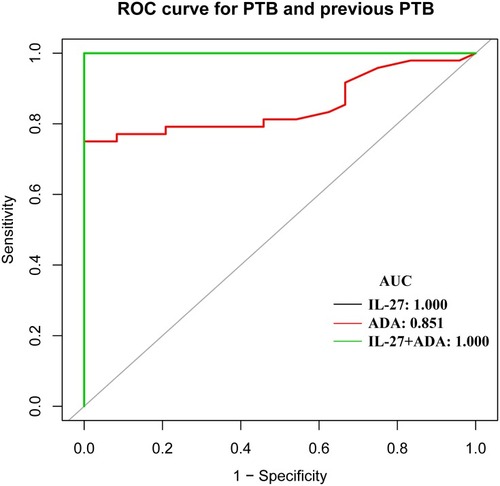
Figure 4 ROC curve for differential diagnosing sputum-negative PTB from sputum-positive PTB.
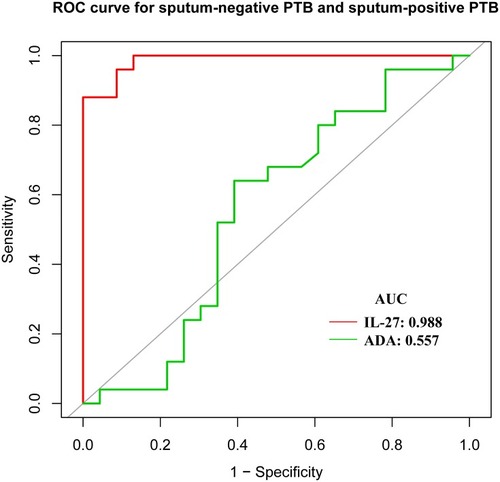
Table 3 Diagnostic Performance of IL-27 and ADA in Differentiating PTB from Lung Cancer
Table 4 Diagnostic Performance of IL-27 and ADA in Differentiating PTB from Previous PTB
Table 5 Diagnostic Performance of IL-27 and ADA in Differentiating Sputum-Negative PTB from sputum-Positive PTB
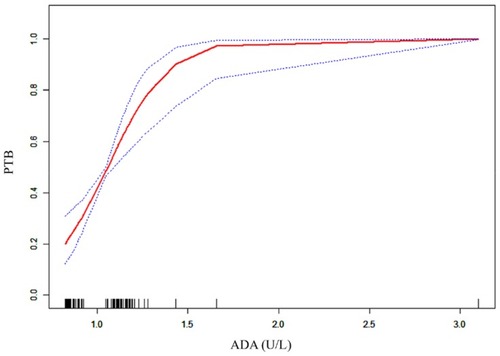
Figure 5 Smooth curve fitting for IL-27 with the risk of PTB.
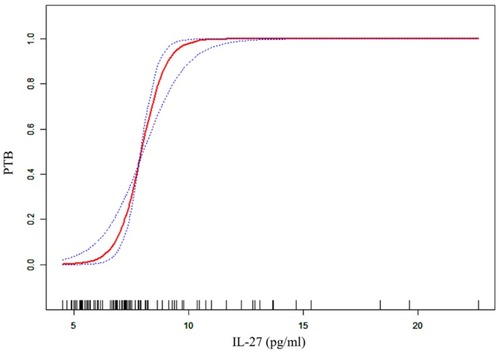
Figure 6 Smooth curve fitting for ADA with the risk of PTB.