164
Views
10
CrossRef citations to date
0
Altmetric
Original Research

Eradication Treatment of Helicobacter pylori Infection Based on Molecular Pathologic Antibiotic Resistance

ORCID Icon, , , ORCID Icon, &
Pages 69-79 | Published online: 07 Jan 2020

Figures & data

Table 1 Patients’ Demographics

Figure 1 Flow diagram of this study.

Figure 1 Flow diagram of this study.

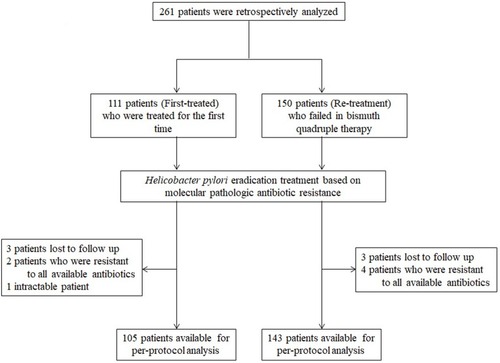
Table 2 Antibiotic Resistance of H. pylori: Molecular Pathologic Results

Figure 2 The prevalence of antibiotic resistance determined by molecular pathologic tests. The gray histogram indicates the percentage of antibiotic resistance in first-treated patients who were treated for the first time, and the black histogram indicates the percentage in re-treatment patients who failed in bismuth quadruple therapy. As demonstrated, the resistance rates to amoxicillin, clarithromycin, fluoroquinolone and tetracycline were 5.5%, 42.1%, 41.7% and 12.9%, in first-treated patients, whereas 11.7%, 79.7%, 70.7% and 30.0%, respectively, in re-treatment patients.

Figure 2 The prevalence of antibiotic resistance determined by molecular pathologic tests. The gray histogram indicates the percentage of antibiotic resistance in first-treated patients who were treated for the first time, and the black histogram indicates the percentage in re-treatment patients who failed in bismuth quadruple therapy. As demonstrated, the resistance rates to amoxicillin, clarithromycin, fluoroquinolone and tetracycline were 5.5%, 42.1%, 41.7% and 12.9%, in first-treated patients, whereas 11.7%, 79.7%, 70.7% and 30.0%, respectively, in re-treatment patients.

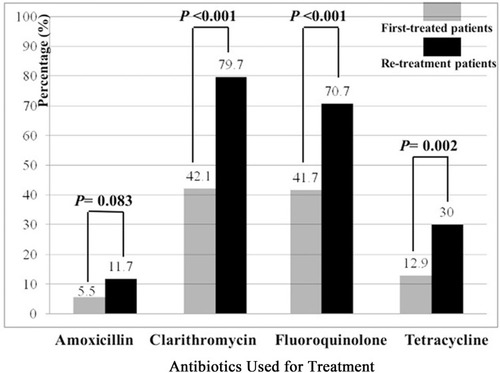
Table 3 Treatment Regimen of H. pylori Eradication

Figure 3 Eradication rates of H. pylori based on molecular pathologic antibiotic resistance. The gray and black histograms indicate the eradication rates in first-treated and re-treatment patients.

Abbreviations: ITT, intention-to-treat analysis; PP, per-protocol analysis.

Figure 3 Eradication rates of H. pylori based on molecular pathologic antibiotic resistance. The gray and black histograms indicate the eradication rates in first-treated and re-treatment patients.Abbreviations: ITT, intention-to-treat analysis; PP, per-protocol analysis.

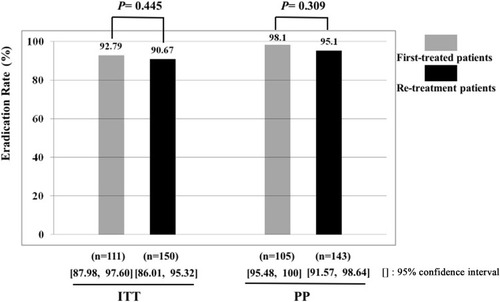
Table 4 Safety and Comparison of Adverse Events