Figures & data
Table 1 Antimicrobial Susceptibility Profile of Enterobacter hormaechei L51
Table 2 Antibiotic Resistance Genes in Plasmid of Enterobacter hormaechei L51
Figure 1 The phylogenetic tree of 61 completed E. hormaechei genome generated by the Harvest suite, where Enterobacter hormaechei SCEH020042 is used as the standard strain. Enterobacter hormaechei subsp. hoffmannii strains and E. hormaechei subsp. xiangfangensis strains are marked in pink and blue, respectively.
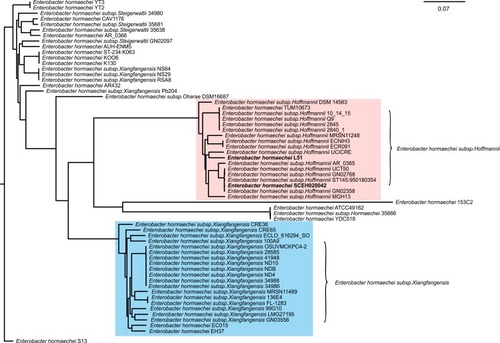
Figure 2 The identification of plasmid size using S1-PFGE (left) and southern blot and hybridization (right). The pEHZJ1 plasmid was between 336.5kbp and 398.4kbp, and was positive for a probe against blaIMP-26.
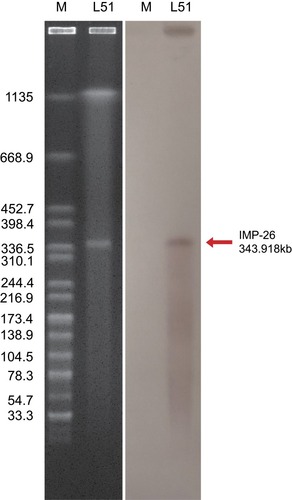
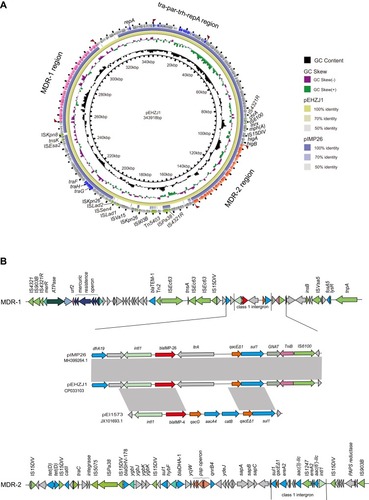
Figure 3 The genetic features of the pEHZJ1 plasmid.
Notes: (A) Comparison of the pEHZJ1 plasmid sequence with pIMP26 using BRIG. The MDR-1 region, MDR-2 region and tra-par-trh-rep region are indicated in orange, pink and dark blue, respectively. Insert sequence and transposons are indicated in green. (B) Genetic features of MDR regions (MDR-1 and MDR-2) and a comparison of genes surrounding blaIMP-26 on pEHZJ1, pIMP26 (GenBank: MH399264.1) and pEI1573 (GenBank: JX101693.1). Gray regions denote regions that are homologous with >95% nucleotide similarity. blaIMP-26 is indicated in red and class 1 integrons are marked by straight lines.