170
Views
10
CrossRef citations to date
0
Altmetric
Case Report

Characterization of the IncFII-IncFIB(pB171) Plasmid Carrying blaNDM-5 in Escherichia coli ST405 Clinical Isolate in Japan

, , , , ORCID Icon, , , , , , , ORCID Icon & show all
Pages 561-566 | Published online: 18 Feb 2020

Figures & data

Figure 1 Comparative genomic analysis among 19 strains of blaNDM-5-positive E. coli ST405. (A) Core-genome SNV analysis and pan-genome analysis. Detected SNVs in the repeat and prophage regions were excluded. Recombination regions of the chromosome were predicted using Gubbins v. 2.3.4, followed by masking SNVs in the recombination regions. A maximum likelihood phylogenetic tree was constructed from 8,857 SNV sites in the core genome region. Pan-genomic analysis was performed using Roary v. 3.12.0. The recombination region and pan-genomic data were visualized using Phandango. The red and light blue bars indicate recombination regions of the ancestral type and single isolate, respectively. The blue bars in pan-genomic data indicate the presence of a gene cluster. (B) Comparative representation of complete blaNDM-5-positive plasmid sequences among five E. coli strains. The plasmid sequences were aligned using BLASTN, followed by visualization using Easyfig. Similarity of homologous and inversion blocks is indicated in red and blue, respectively. The backbone of the IncFII-IncFIB(pB171) plasmids is highly conserved among the different ST types. (C) S1-PFGE analysis of E. coli KY1497.

Figure 1 Comparative genomic analysis among 19 strains of blaNDM-5-positive E. coli ST405. (A) Core-genome SNV analysis and pan-genome analysis. Detected SNVs in the repeat and prophage regions were excluded. Recombination regions of the chromosome were predicted using Gubbins v. 2.3.4, followed by masking SNVs in the recombination regions. A maximum likelihood phylogenetic tree was constructed from 8,857 SNV sites in the core genome region. Pan-genomic analysis was performed using Roary v. 3.12.0. The recombination region and pan-genomic data were visualized using Phandango. The red and light blue bars indicate recombination regions of the ancestral type and single isolate, respectively. The blue bars in pan-genomic data indicate the presence of a gene cluster. (B) Comparative representation of complete blaNDM-5-positive plasmid sequences among five E. coli strains. The plasmid sequences were aligned using BLASTN, followed by visualization using Easyfig. Similarity of homologous and inversion blocks is indicated in red and blue, respectively. The backbone of the IncFII-IncFIB(pB171) plasmids is highly conserved among the different ST types. (C) S1-PFGE analysis of E. coli KY1497.

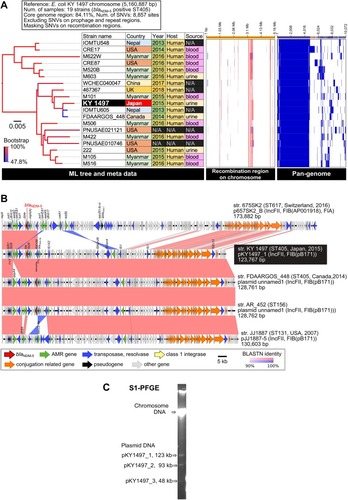
Table 1 Antimicrobial Susceptibility Profile of E. coli Isolate with the blaNDM-5 Gene and Its Transconjugant