
Figures & data
Table 1 Isolation Source, Underlying Disease of Patients, and Phenotypic and Biochemical Features of Actinomycetes Isolated from Clinical Samples
Figure 1 16SrRNA sequence based phylogenetic tree for Iranian actinomycetes isolates and nearest validated species of actinomycetes by using the neighbor-joining method. The figures at each node represent bootstrapping values. The tree was rooted with Gordonia terrae.
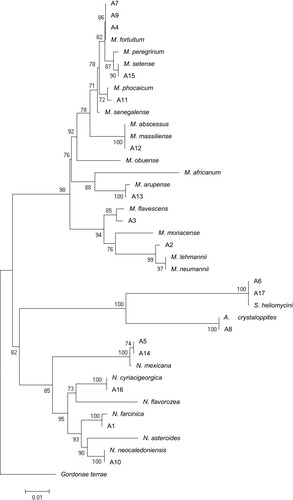
Table 2 MIC Range and Susceptibility Pattern of Iranian Actinomycetes Using the Broth Microdilution Method