Figures & data
Table 1 Demographic, Clinical and Neruopsychological Data of the Three Groups
Table 2 Brain Regions with DC Differences Among the Three Groups
Figure 1 DC differences among HIV+/syphilis+, HIV+/syphilis- and HC groups.
Notes: F-test of ANOVA showed DC differences mainly located in bilateral frontal cortex, left occipital cortex, and bilateral inferior parietal lobule (yellow). HIV+/syphilis+ showed decreased DC in the right frontal cortex and increased DC in the bilateral inferior parietal cortex and left occipital cortex. HIV+/syphilis- showed decreased DC in the right frontal cortex and increased DC in the left inferior parietal cortex. Compared with HIV+/syphilis-, HIV+/syphilis+ displayed decreased DC in the left occipital cortex. (P<0.005, cluster number = 249, α = 0.05, corrected). Increased DC was shown in red, while decreased DC was shown in green.
Abbreviations: ANOVA, analysis of variance; DC, functional connectivity density; HIV+/syphilis+, HIV patients with syphilis coinfection; HIV+/syphilis-, HIV patients without syphilis coinfection; HC, healthy controls.
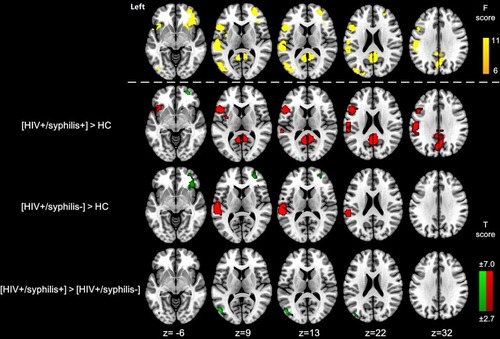
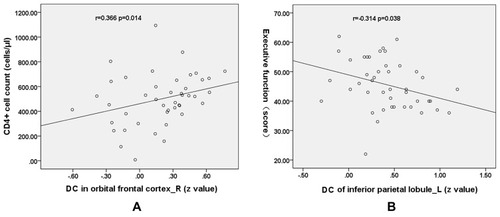
Figure 2 Pearson correlation between DC values and clinical variables and cognitive metrics in HIV+/cART+.
Notes: The mean z value of DC in the right orbital-frontal cortex was positively correlated to the CD4+ cell counts (r = 0.366, P = 0.014) (A). The mean z value of DC in the left inferior parietal lobe was negatively correlated to the executive function score (r = −0.314, P = 0.038) (B).