
Figures & data
Figure 1 Detailing the characteristic of patient samples.
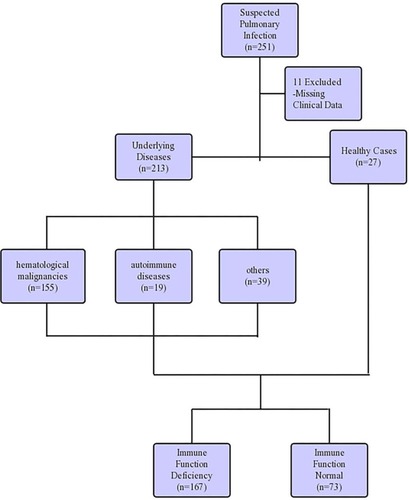
Table 1 Demographic Characteristics of Pulmonary Infection and Non-Pulmonary Infection
Table 2 Detection Rate of Organism of Pulmonary Infection in mNGS Compared with Traditional Detection Method
Figure 2 The bar chart shows the comparison of positive results between metagenomic next-generation sequencing and traditional pathogen detection in the pulmonary infection group and non-pulmonary infection group.
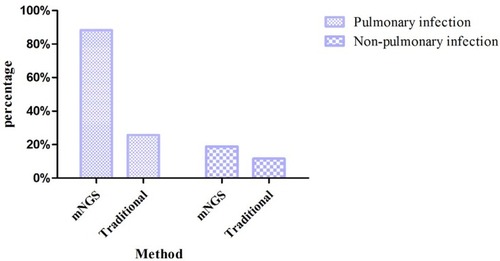
Table 3 Comparison of Sensitivity and Specificity Between mNGS and Traditional Detection Method
Table 4 Infection Status of All Patients at a 1-Month Follow-Up According to the Metagenomic Next-Generation Sequencing Result