Figures & data
Table 1 Antibiotic Resistant Pattern of K pneumoniae and P aeruginosa Isolates
Table 2 Inhibition Zone Diameters Induced by CSF on K pneumoniae and P aeruginosa
Figure 1 CFS of L acidophilus decreased the growth of both K pneumoniae (A) and P aeruginosa (B) in a time-dependent manner.
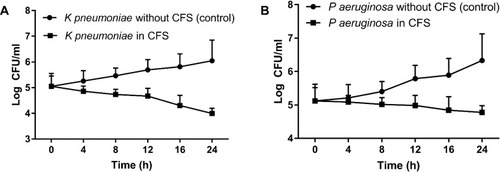
Figure 2 Anti-biofilm activity of different concentrations of L acidophilus-CFS against K pneumoniae and P aeruginosa (A), and against 24 h-old biofilms (B) of K pneumoniae and P aeruginosa.
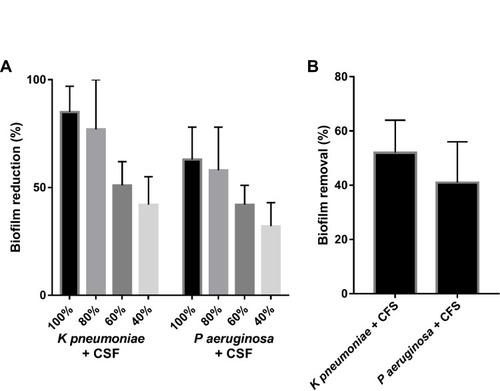
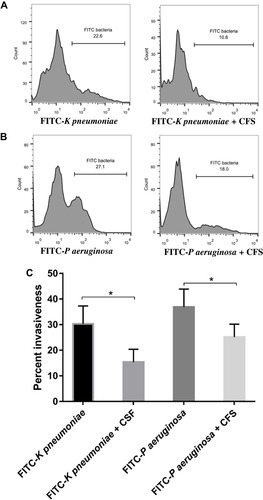
Figure 3 CFS of lactobacilli decreased the invasive ability of FITC-labelled K pneumoniae (A) and FITC-labelled P aeruginosa (B) on 293 cells. The mean percent of 15 independent experiments using 15 different clinical isolates of K pneumoniae and P aeruginosa is shown in (C). 293 Cells were treated with indicated FITC-labelled bacteria in normal culture or in the presence of CFS and analyzed after 6 h of incubation with flow cytometry. *Refer to significant difference with p<0.05.