Figures & data
Table 1 Descriptions of the Five Cases Involved in the February 16th Outbreak in the NICU
Figure 1 The timeline of patient admission and ESBL-producing K. pneumoniae isolation. Shadows on the timeline represent the duration of the case. Different wards are indicated in different colors. The red arrows indicate the isolation of the strains. Light red arrows represent sampling where no K. pneumoniae was isolated.
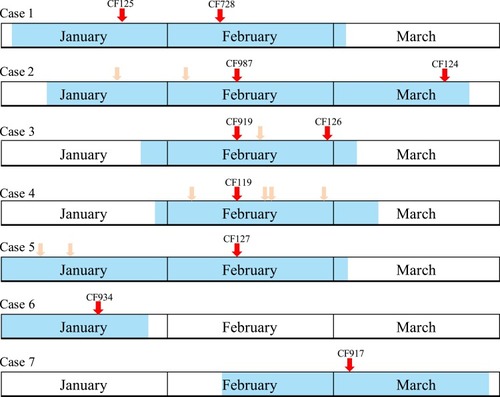
Figure 2 Clustering of the 30 K. pneumoniae strains based on their PFGE patterns. The outbreak and outbreak-related strains are framed. The information for strain ID, isolation date, ward, type of specimen, and PFGE type is listed to the left of the patterns.
Abbreviations: NICU, neonatal intensive care unit; PFGE, pulsed-field gel electrophoresis.
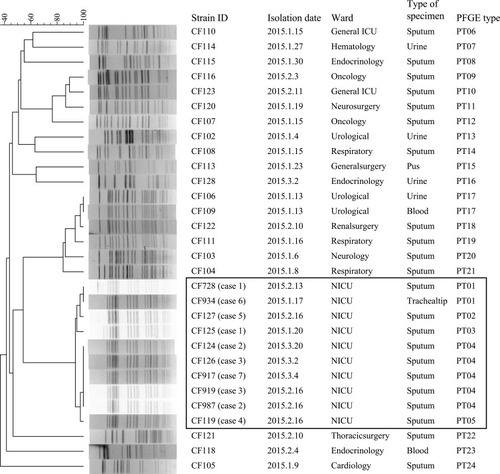
Figure 3 Heat map of SNP distribution of ten ESBL-producing K. pneumoniae.
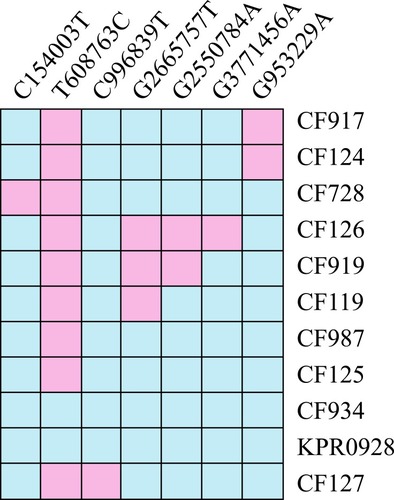
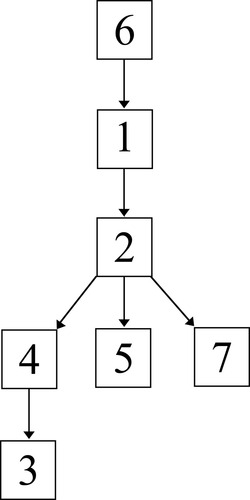
Figure 4 Evolutionary relationships based on MCG typing of ten ESBL-producing K. pneumoniae. Isolates from different cases are indicated in different colors. SNPs are marked on the connecting lines.
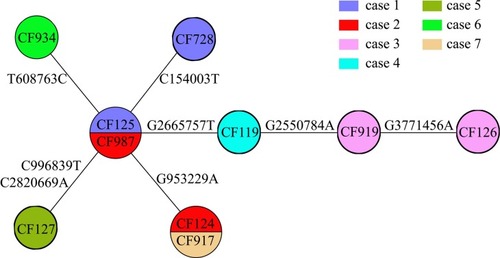
Figure 5 Putative map of ESBL-producing K. pneumoniae transmission during the outbreak. The transmission map was constructed using genetic and patient trace data. Nodes represent patients, and arrows indicate a transmission event directly from one patient to another.