Figures & data
Table 1 The Sequences of Primers
Figure 1 Incubation with T. marneffei conidia spores upregulates CD11b expression in mouse macrophages. RAW 264.7 cells and pMacs from healthy and immunosuppressed BALB/c mice were incubated with, or without, heat-killed T. marneffei conidia spores at a ratio of 1:5 for 1.5 hrs. The levels of CD11b mRNA transcripts and protein expression were determined by RT-PCR and Western blot. Data are representative images or expressed as the mean ± SD of each group of cells from three separate experiments. (A) The relative levels of CR3 mRNA transcripts. (B) The relative levels of CR3 protein. a: pMacs from the healthy mice without T. marneffei conidia spores, b: pMacs from the immunosuppressed mice without T. marneffei conidia spores, c: RAW 264.7 without T. marneffei conidia spores, d: pMacs from the healthy mice with T. marneffei conidia spores, e: pMacs from the immunosuppressed with T. marneffei conidia spores, f: RAW 264.7 with T. marneffei conidia spores. *P<0.05 vs before co-culture.
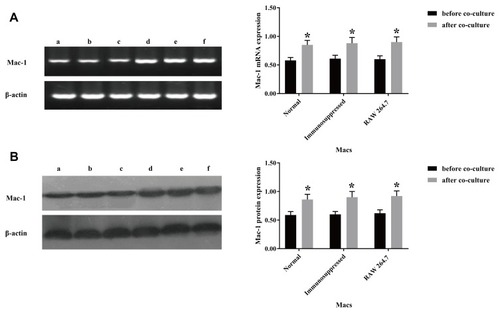
Figure 2 The conidia spores and yeast cells of T. marneffei upregulate CD11b expression in mouse macrophages. pMacs from healthy BALB/c mice were incubated with living or heat-killed conidia spores and yeast cells of T. marneffei at a ratio of 1:5 for 1.5 hrs. The relative levels of CD11b mRNA transcripts and protein expression were determined by RT-PCR and Western blot. Data are representative images or expressed as the mean ± SD of each group of cells from three separate experiments. (A) The relative levels of CD11b mRNA transcripts. (B) The relative levels of CD11b protein. a: pMacs from the healthy mice without T. marneffei; b: pMacs stimulated with heat-killed spores; c: pMacs stimulated with living spores; d: pMacs stimulated with heat-killed yeast; e: pMacs stimulated with living yeast. *P<0.05 vs the control.
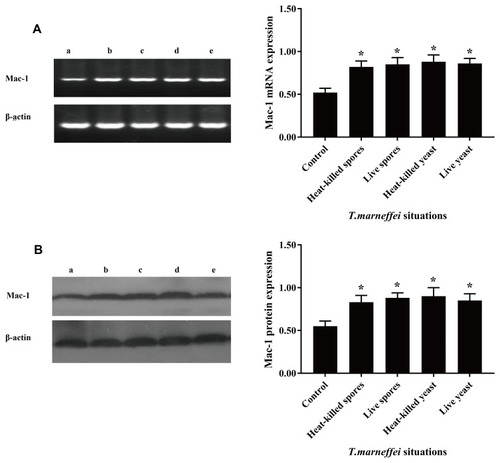
Figure 3 Knockdown of CD11b expression in macrophages. RAW264.7 cells were cultured overnight and transfected with the indicated siRNA at an optimal dose for the indicated time periods. The relative levels of CD11b mRNA transcripts and protein expression were determined by RT-PCR and Western blot. Data are representative images or expressed as the mean ± SD of each group of cells from three separate experiments. (A) The relative levels of CD11b mRNA transcripts. (B) The relative levels of CD11b protein. Transfection with siRNA Irgam-mus-3511 or Itgam-mus-1369 effectively reduced the CD11b expression in a time-dependent manner in RAW264.7 cells. *P<0.05, **P<0.01 vs the control.
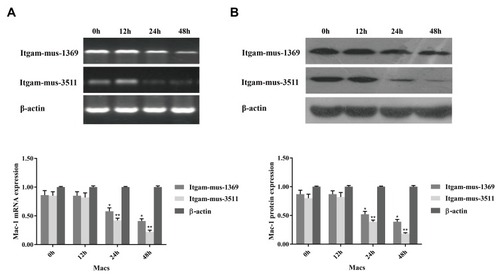
Figure 4 Flow cytometry detects the phagocytosis of T. marneffei by mouse macrophages. RAW 264.7 cells and pMacs from healthy and immunosuppressed BALB/c mice were pre-treated in triplicate with vehicle or anti-CD11b for 20 mins and incubated with FITC-labeled spores of T. marneffei at a ratio of 1:5 for 2 hrs. After being washed and quenched with trypan blue, the percentages of FITC+ cells were determined by flow cytometry. (A) Control macrophages from healthy mice without incubation with FITC-labeled spores of T. marneffei. The RAW264.7 cells, pMac from the healthy or immunosuppressed BALB/c mice with positive phagocytosis of T. marneffei were 91.63%±2.59, 89.26%±3.48, 65.75%±2.81 (B, C, D), respectively. Pre-treatment with anti-CD11b, the positive phagocytosis was 35.45%±3.15 (E). After transfected with control or CD11b-specific siRNAs, the positive phagocytosis macrophages were 10.89%±3.51 (Itgam-mus-3511), 21.56%±2.86 (Itgam-mus-1369), respectively (F, G). Data are representative flow charts from three separate experiments.
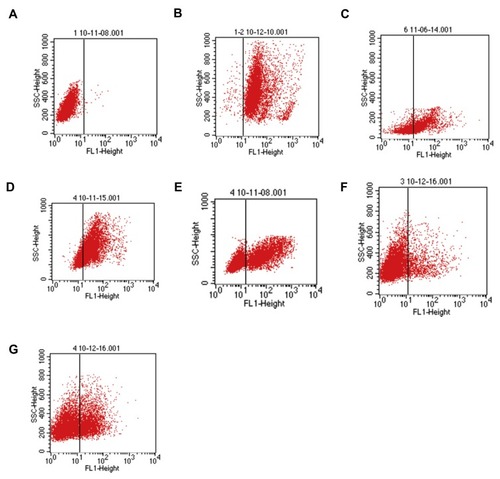
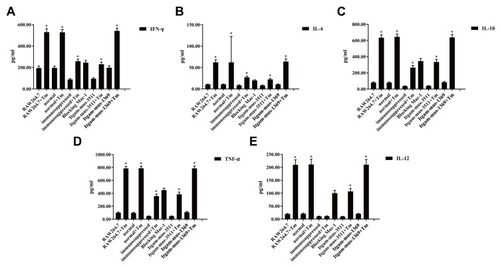
Figure 5 Blocking CD11b mitigates and abrogates T. marneffei–induced cytokine production by macrophages. RAW264.7 cells were transfected with the indicated siRNA for 48 hrs. pMacs from the healthy mice were pre-treated with anti-CD11b for 20 mins. The unmanipulated RAW264.7, pMacs from the healthy and immunosuppressed mice, siRNA-transfected RAW264.7, anti-CD11b treated pMacs were incubated with heat-killed spores of T. marneffei at a ratio of 1:5 for 2 hrs. The concentrations of individual cytokines in the supernatants of cultured cells were determined by ELISA. Data are expressed as the mean ± SD of each group of cells from three separate experiments. There were high levels of pro-inflammatory IFN-γ (A), TNF-α (D) and IL-12 (E), but low levels of anti-inflammatory IL-4 (B) and IL-10 (C), in the cells simulated with the spores of T. marneffei. The cytokine responses stimulated by T. marneffei were mitigated and abrogated by pre-treatment with anti-CD11b or knockdown of CD11b expression in macrophages. *P<0.05 vs the control without T. marneffei .