Figures & data
Table 1 Comparison of Species Identification of Clinically Obtained Yeast Species with MALDI-TOF MS and Hi Chrome chromogenic media
Figure 1 Percentage of in vitro antifungal susceptibility testing of five antifungal agents (i.e., clotrimazole, fluconazole, itraconazole, ketoconazole, nystatin) against 157 yeasts isolated during the study.
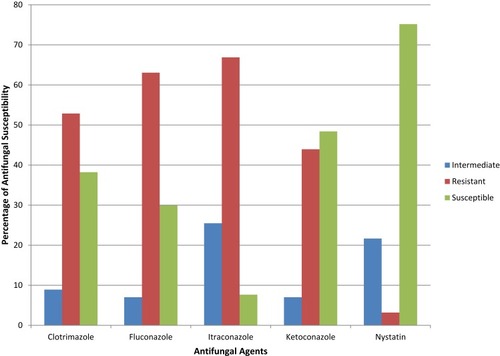
Figure 2 Confocal images of invasion of yeasts in HeLa cells. The hyphae of Candida albicans strain 8_1 invaded HeLa cells. Cells from a colony of C. albicans 8_1 were seeded with HeLa cells and incubated for 3 hours at 37°C and 5% CO2. Actin remodeling was observed by staining cells with FITC-Phalloidin and red arrow indicates the cell invasion by C. albicans as seen by polymerized actin (green in color) surrounding the invading hyphae. Nuclear material is stained with DAPI (blue) for easy localization of cells.
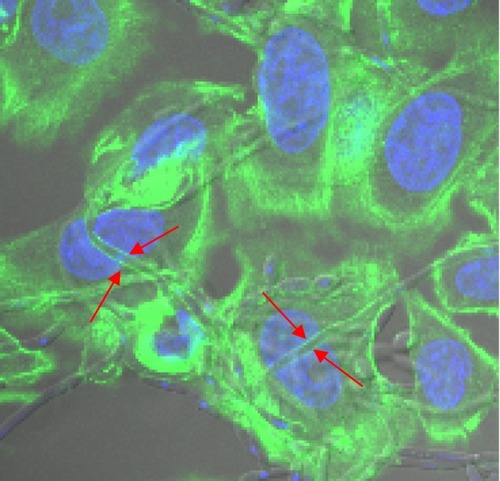
Table 2 Epidemiological Data and Prevalence of Yeast Species in Different Clinical Samples
Figure 3 Venn diagram exhibiting the yeast species shared and unique to the different clinical samples.
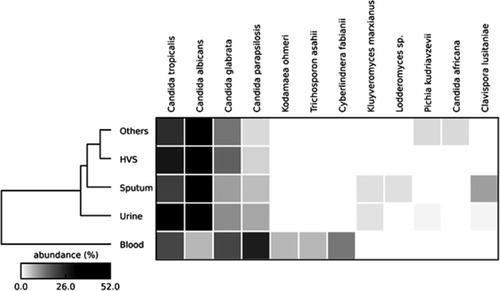
Figure 4 Relative abundance of yeasts species isolated from different clinical sources.
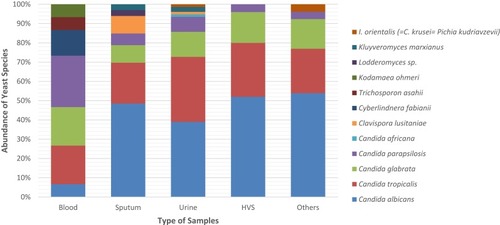
Figure 5 Phylogenetic tree constructed using 28S rRNA gene sequences of 176 isolated yeasts strains along with homologous sequences from type strains of closest match in GenBank. The evolutionary history was inferred using the NJ method. The optimal tree with the sum of branch length = 1.29 shown. The evolutionary distances were computed using the Kimura 2-parameter method and are in the units of the number of base substitutions per site. The analysis involved 190 nucleotide sequences. There were a total of 694 positions in the final dataset. Evolutionary analyses were conducted in MEGA7.
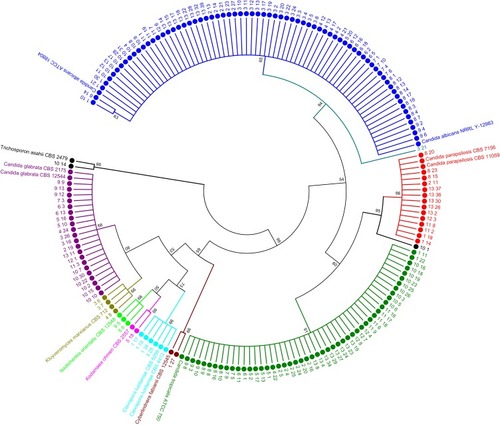
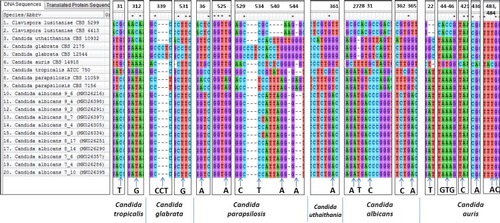
Figure 6 Nucleotide changes at various loci in the LSU region of rRNA gene among various species of Candida which can be considered as species specific markers. A total of 20 sequences (including nine sequences from the database) consisting of 535 sites has been aligned in CLUSTALW using MEGA7.0 software.