
Figures & data
Table 1 Distribution of Tuberculosis with Socio-Demographic and Clinical Variables in Northwestern Tigrai, Ethiopia from January 2013 to December 2018 (n = 7639)
Figure 1 Trend of tuberculosis in Northwestern Tigrai, Ethiopia from January 2013 to December 2018.
Abbreviation: TB, Tuberculosis.
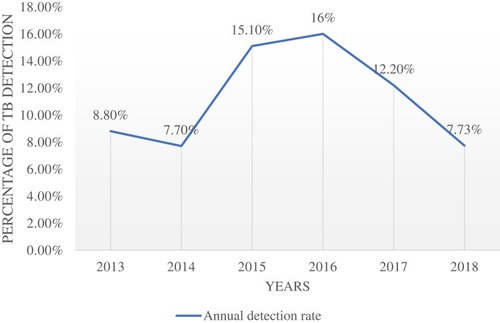
Figure 2 Distribution of tuberculosis among different age groups in Northwestern Tigrai, Ethiopia from January 2013 to December 2018.
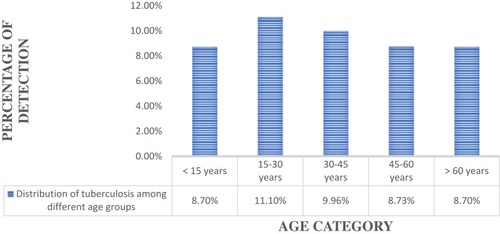
Table 2 Bivariate and Multivariate Analysis of Factors Associated with Tuberculosis Among Presumptive Clients in Northwestern Tigrai, Ethiopia from January 2013 to December 2018 (n = 7639)