Figures & data
Figure 1 Talaromyces marneffei yeast cells induced the activation of DCs and the secretion of IL-6, IL-10 and TGF-β. DCs were cultured with or without yeast cells of TM (DCs: yeasts=1: 5) for 24 h, and the percentages of DCs expressing CD80 and CD86 on the surface were detected by flow cytometry. (A) Representative histograms of CD80 (left panel) and CD86 (right panel) are shown for un-stimulated and yeast-stimulated DCs. Comparisons of the percentages of (B) CD80 and (C) CD86 on DCs. In addition, the concentrations of (D) IL-6, (E) IL-10, and (F) TGF-β in the culture supernatant were detected by ELISA. Data are expressed as mean± SD (n=10). *P < 0.05, ***P < 0.001.
Abbreviations: DC, dendritic cell; TM, Talaromyces marneffei; CD, cluster differentiation; IL-6, interleukin 6; IL-10, interleukin 10; TGF-β, transforming growth factor β; SD, standard deviation.
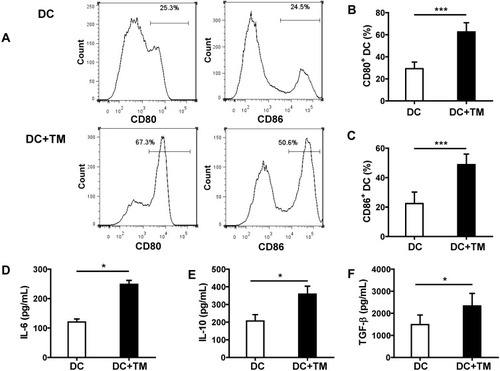
Figure 2 Talaromyces marneffei yeast cells promoted Treg expansion and limited Th17 generation in the presence of DCs. CD4+ T lymphocytes were co-cultured with yeast cells of TM with or without DCs (CD4+ T lymphocytes: DCs: yeasts=10: 1: 5). The proportions of Treg and Th17 cells in the co-culture were detected by flow cytometry. (A) Gating strategy for Treg and Th17 cells. Treg cells were identified as CD4+CD25+Foxp3+ cells and Th17 cells were identified as CD4+IL-17+ cells. Representative scatter plots of Treg and Th17 cells in the co-culture. Comparisons of the percentages of (B) Treg cells and (C) Th17 cells in the co-culture. Data are expressed as mean ± SD (n=10). *P < 0.05.
Abbreviations: DC, dendritic cell; TM, Talaromyces marneffei; CD, cluster differentiation; IL-17, interleukin 17; SD, standard deviation; NS, not significant.
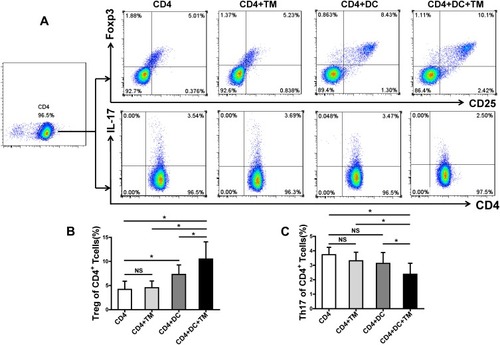
Figure 3 Talaromyces marneffei yeast cells up-regulated Foxp3 mRNA expression and down-regulated RORγt mRNA mediated by DCs. The mRNA expression levels of RORγt and Foxp3 in the co-culture of CD4+ T lymphocytes, DCs, and yeast cells of TM were detected by qRT-PCR. Comparisons of (A) Foxp3 mRNA and (B) RORγt mRNA in co-cultured cells. Data are expressed as mean ± SD (n=6). *P < 0.05, **P < 0.01.
Abbreviations: DC, dendritic cell; TM, Talaromyces marneffei; CD, cluster differentiation; RT-PCR, real-time polymerase chain reaction; Foxp3, forkhead box protein 3; RORγt, RAR-related orphan receptor γt; SD, standard deviation; NS, not significant.
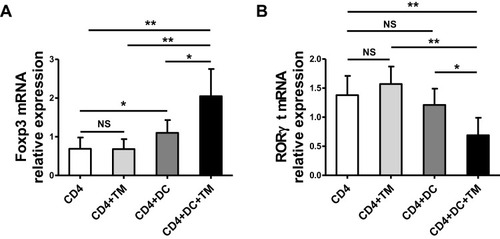
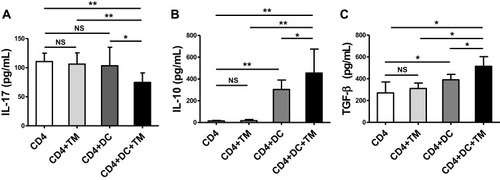
Figure 4 Talaromyces marneffei yeast cells induced high levels of IL-10 and TGF-β secretion. The concentrations of IL-17, IL-10, and TGF-β in the supernatants of the co-culture of CD4+ T lymphocytes, DCs, and yeast cells of TM were detected by ELISA. Comparison of (A) IL-17A, (B) IL-10, and (C) TGF-β levels in supernatants of the co-cultured cells. Data are expressed as mean ± SD (n=10). *P < 0.05, **P < 0.01.
Abbreviations: DC, dendritic cell; TM, Talaromyces marneffei; CD, cluster differentiation; IL-17, interleukin 17; IL-10, interleukin 10; TGF-β, transforming growth factor β; SD, standard deviation; NS, not significant.