Figures & data
Table 1 Association of Demographic Profile and Mutations at Different Probe Sites Among the RR-TB Cases
Table 2 Pattern of Probe Dropouts in Xpert Assay Among Beijing and Non-Beijing RR-TB Isolates
Table 3 Detection of Probe Dropout Among Different Lineages in RR-TB Cases
Table 4 Frequency of Specific Mutations Based on MTBDRplus Probe Binding Among the Beijing and Non-Beijing Isolates (n=205)
Table 5 Comparison of Specific Probe Mutations Based on Xpert and MTBDRplus Assay Among the Beijing and Non-Beijing Isolates (n=200)
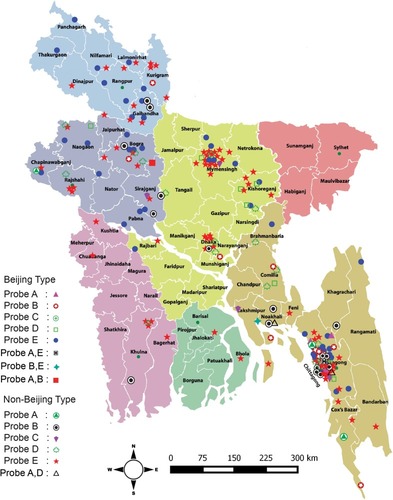
Figure 1 Geographical distribution of probe mutations detected by Xpert assay among the Beijing and non-Beijing MTB isolates. Individual shape with different color denoted as different probe mutation among Beijing and non-Beijing isolates. Different colors on the map indicate seven divisions of Bangladesh.