
Figures & data
Table 1 List of Primers Used in This Study
Table 2 Distribution of Virulence Properties Among E. coli Clinical Isolates Collected from Different Infections
Table 3 Distribution of Virulence Genes Among E. coli Clinical Isolates Collected from Different Infections
Figure 1 Virulence genotypes of the tested E. coli isolates based on the type of samples. (A): Stool and urine samples. (B): Wound and urine samples. (C): Blood and urine samples. (D): Blood and stool samples. (E): Wound and stool samples. (F): Blood and wound samples.
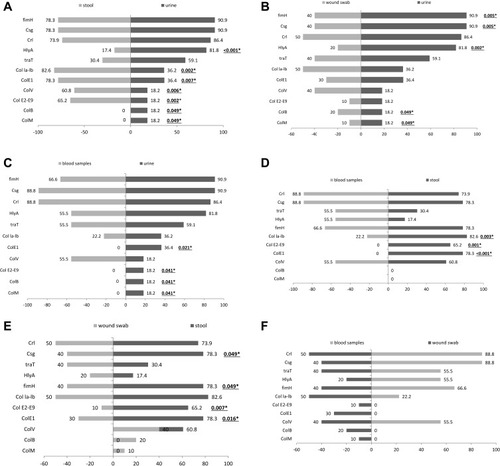
Figure 2 Distribution of antibiotic resistance among E. coli clinical isolates of different sources.
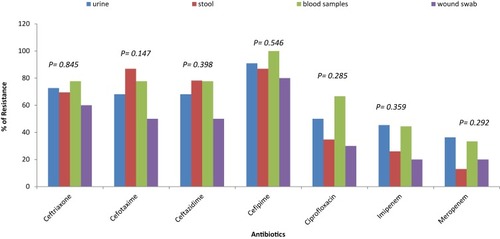
Table 4 Distribution of ESBL Production and Resistance Genes Among the Isolated E. coli from Different Sources
Table 5 Relationships Between Virulence Factors Genes and Resistance Genes in Uropathogenic E. coli Isolates
Table 6 Relationships Between Virulence Factors Genes and Resistance Genes in E. coli Isolated from Wound Samples
Table 7 Relationships Between Virulence Factors Genes and Resistance Genes in Fecal E. coli Isolates
Table 8 Relationships Between Virulence Factors Genes and Resistance Genes in E. coli Isolated from Blood Samples