Figures & data
Table 1 Susceptibility of the Major Causative Microorganisms in Liver Cirrhosis Patients
Table 2 Clinical Characteristics and Outcomes of 84 Patients with GNB-BSI Treated by BLBLIs or CARs
Figure 1 Patients inclusion flowchart.
Abbreviations: GNB, Gram-negative Bacteria; BSI, Bloodstream infection; BLBLIs: β-lactam/β-lactamase inhibitor combinations; CARs, Carbapenems.
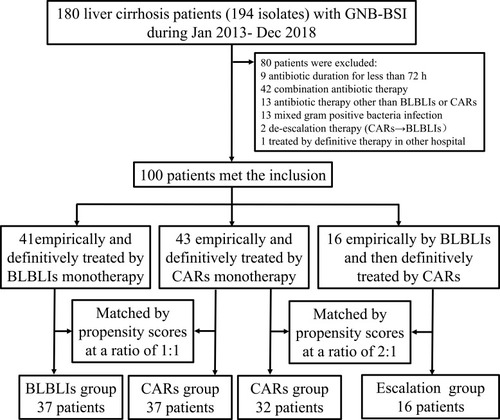
Figure 2 Kaplan–Meier curves of the time to defervescence within 3 days after BSI onset in 84 liver cirrhosis patients.
Abbreviations: BLBLIs, β-lactam/β-lactamase inhibitor combinations; CARs, Carbapenems.
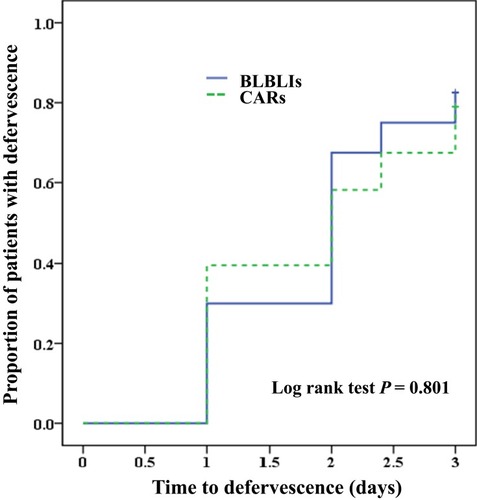
Table 3 Univariate and Multivariate Logistic Regression Analysis of Antibiotic Responses at 10 Days After Antibacterial Treatment
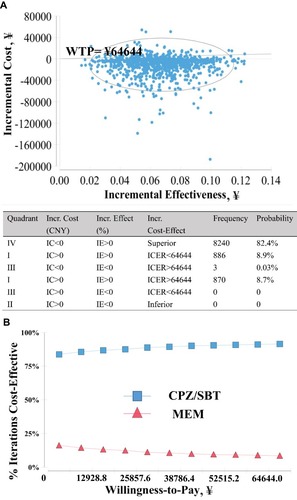
Table 4 Cost-Effectiveness of Cefoperazone/Sulbactam and Meropenem for Treatment of Cirrhotic Patients with GNB-BSI
Figure 3 Incremental cost-effectiveness plane and table, with cost-effectiveness acceptability curves (CEAC). (A) Monte Carlo simulation. Each blue spot represents one of the 10,000 iterations. (B) Cost-effectiveness acceptability curves.
Abbreviations: CPZ/SBT, cefoperazone/sulbactam; MEM, meropenem; Incr. Cost, incremental cost; Incr. Eff, incremental effectiveness; Incr. Cost-Effect, Incremental cost-effectiveness.