Figures & data
Figure 1 The Molecular typing of 36 carbapenem-resistant Serratia marcescens (CRSM) isolates by two methods. (A). Pulsed-field gel electrophoresis (PFGE) typing. The isolates were divided into 5 cluster types including cluster A, B, C, D and E based on the cutoff values. (B). The local ad hoc scheme of Core genome multilocus sequence typing (cgMLST). Isolates with no less than 14 different allelic genes were identified as follows: C60, 3717, 3460 and 3725 (in red boxes), 3024 (in green), 4201 (in purple).
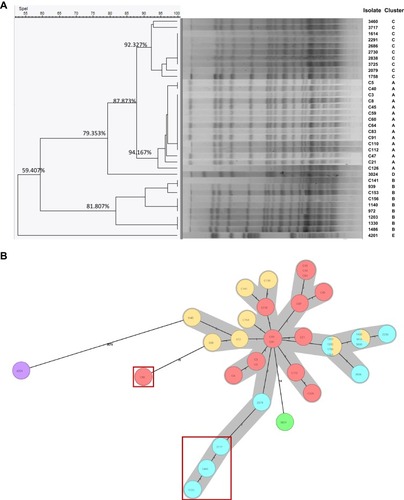
Table 1 The MIC Distribution of 36 CRSM
Table 2 The Distribution of Antibiotic Resistance Genes in 36 CRSM Isolates
Table 3 Antibiotic Susceptibilities of Transconjugants and E. coli J53
Table 4 Characteristics of the Nanopore-Sequenced Genome Assembly of Five CRSM
Figure 2 The circular maps of pC110-KPC and p4201-KPC. (A). The circle in yellow represented plasmid pC110-KPC, in orange represented pSZF_KPC, in red represented p628-KPC. (B). The circle in purple represented p4201-KPC, in blue represented pHS091157. The peak map in (A) and (B) represented the GC content of plasmid pC110-KPC and p4201-KPC respectively. Arcs in grey indicate the position of blaKPC and blaqnr in plasmids pC110-KPC and p4201-KPC. The maps were created by Brig v0.95.
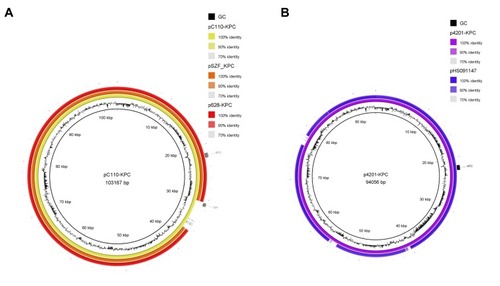
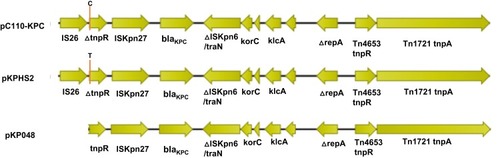
Figure 3 A schematic diagram of the genetic structure surrounding blaKPC-2. The genetic structure surrounding blaKPC-2 in the plasmid pC110-KPC represented all plasmids harbouring blaKPC-2 in this study. The positions indicated by orange lines are the point mutation positions at which C and T are in plasmids pC110-KPC and pKPHS2, respectively. The direction of the arrow represents the direction of transcription.