Figures & data
Table 1 The List of Primer Sequences Used for PCR Conditions
Table 2 Resistance Patterns of Ceftazidime-Avibactam and Ceftolozane-Tazobactam Resistant P. aeruginosa Isolates
Table 3 Antibiotic Resistance Patterns of the 16 Resistant Isolates to CZA and C/T
Table 4 Distribution of the Resistance Genes Among the Isolates and Their Relationships with Production of ESBL and MBL
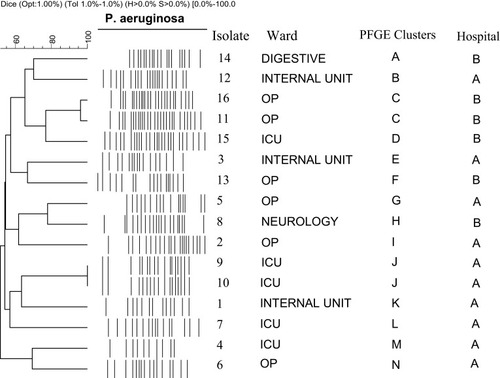
Figure 1 Genomic analysis of the isolates using PFGE. Dendrogram was constructed based on UPGMA by using Dice coefficient with a 1.0% band position tolerance. The scale above the dendrogram shows percentage of similarity and the dotted line indicates 85% similarity.
Abbreviations: OP, outpatient; ICU, intensive care unit.