Figures & data

Table 1 Antimicrobial Susceptibility Profile of 2 Strains of Staphylococcus aureus to Penicillin-G
Table 2 Multiple Reaction Monitoring (MRM) Parameters for Penicillin-G and Plasma Biomarker (Penicilloic Acid of Penicillin-G), and Validation Data for Developed Analytical Method
Table 3 Ratio of Signal Intensities of Hydrolyzed Penicillin-G and Active Penicillin-G at Different Time Intervals After Injecting Penicillin-G to Infected/Non-Infected Chickens
Figure 1 Representative chromatograms and intensities of active penicillin-G and hydrolyzed penicillin-G in chicken blood. (A) Liquid chromatography quadrupole time-of-flight mass spectrometry (LC/Q-TOF/MS) chromatograms of penicillin-G and penicilloic acid of penicillin-G extracted from antibiotic-spiked blood samples of chicken (in vitro). Changes in the signal intensities (mean±standard deviation) of penicillin-G (B) and the hydrolyzed form of penicillin-G (C) in the blood samples of infected or non-infected chickens at different time intervals. (D) Representative chromatograms obtained by liquid chromatography–mass spectrometry (LC-MS/MS) show the changes of intensities of active penicillin-G (pink-colored picks) and hydrolyzed penicillin-G (blue-colored picks) in chicken blood in presence of (I, II) susceptible and (III, IV) resistant Staphylococcus aureus. The chromatograms (I and III) were obtained from the blood sample collected after 5 min of drug administration, and the chromatograms (II and IV) were collected after 30 min of drug administration.
Abbreviations: CPD, compound; EIC, extracted ion chromatogram; FBF, finding by formula; TIC, total ion chromatogram.
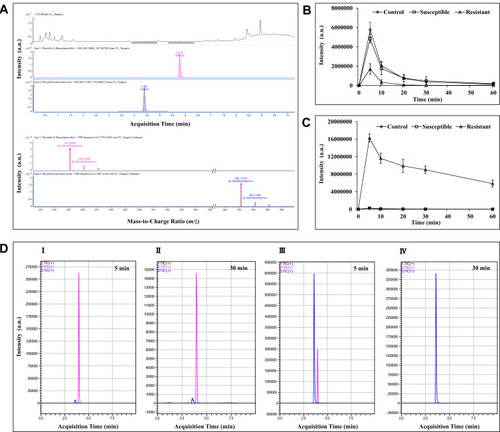
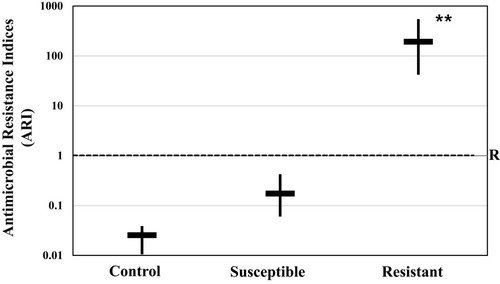
Figure 2 Antimicrobial resistance indices (ARI) of susceptible and resistant Staphylococcus aureus cells in blood samples (30 min) of chicken bacteremia model. ARI values less than “1” and greater than “1” indicate that the bacterial cells inside the patient are susceptible and resistant to penicillin-G, respectively. Results are shown as mean±SD from blood samples of seven chickens in each group. **Indicates significant difference (p <0.05) than other groups. “R” indicates the critical ARI value for susceptibility/resistance.