
Figures & data
Table 1 The Primers Used in the Current Report
Figure 1 Sequence and location of nuc (A) and mecA (B) genes used to design loop-mediated isothermal amplification primers. The nucleotide sequences of the sense strand of nuc and mecA are listed. Right arrows and left arrows indicate sense and complementary sequences that are used.
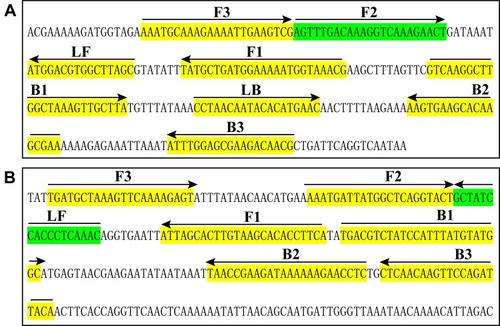
Table 2 Bacterial Strains Used in the Current Study
Figure 2 Detection and confirmation of nuc- and mecA-LAMP products. A (left), B (left) and C (left), Color change of nuc-, mecA- and multiplex LAMP tubes; A (right), B (right) and C (right), LFB applied for visual detection of nuc-, mecA- and multiplex LAMP products. Tube A1, B1 and C1, positive amplification; tube A2, B2 and C2, negative amplification (S. pneumonia), tube A3, B3 and C3, negative amplification (L. monocytogenes), tube A4, B4 and C4, negative control (DW); Biosensor A1, B1 and C1, positive amplification; biosensor A2, B2 and C2, negative amplification (S. pneumonia), biosensor A3, B3 and C3, negative amplification (L. monocytogenes), biosensor A4, B4 and C4, negative control (DW).
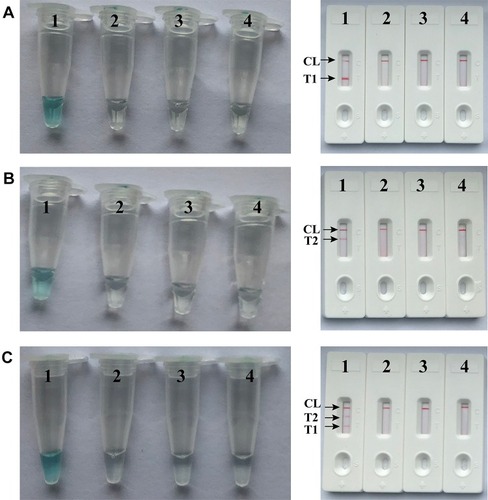
Figure 3 Optimal amplification temperature for nuc- and mecA-LAMP primer sets. The conventional LAMP reactions for detection of nuc (A) and mecA (B) were monitored by real-time measurement of turbidity and the corresponding curves of concentrations of templates were marked in the figures. The threshold value was 0.1 and the turbidity of >0.1 was considered to be positive. Six kinetic graphs (1–6) were obtained at various temperatures (61 oC-66°C, 1°C intervals) with target pathogens DNA at the level of 10 pg per vessel. (A) the graphs from 2 (62°C) to 5 (65°C) showed robust amplification; (B) the graphs from 2 (62°C) to 4 (64°C) showed robust amplification.
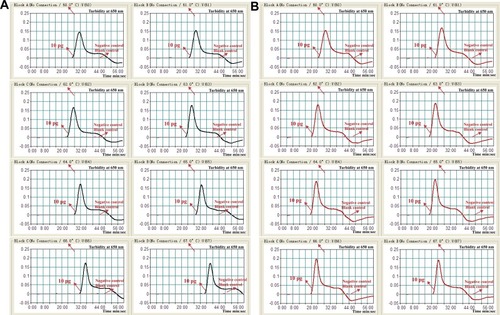
Figure 4 Detection of a single target in a LAMP reaction. Two sets of LAMP primers targeting the nuc (A) and mecA (B) genes were used in different reactions and the serial dilutions (1 ng, 100 pg, 10 pg, 1 pg, 100 fg, 10 fg and 1 fg) of target templates were subjected to conventional LAMP reactions. A (top) and B (top), LFB applied for visual detection of nuc- and mecA-LAMP products. A (bottom) and B (bottom), VDR applied to nuc- and mecA-LAMP products. Biosensors A1-A7 (Tubes A1-A7), S. aureus (ATCC 43300) genomic templates (1 ng-1 fg), biosensors A8 (Tube A8), negative control (DW). Biosensors B1-B7 (Tubes B1-B7), S. aureus (ATCC 43300) genomic templates (1 ng-1 fg), biosensors B8 (Tube B8), negative control (DW). NC, negative control.
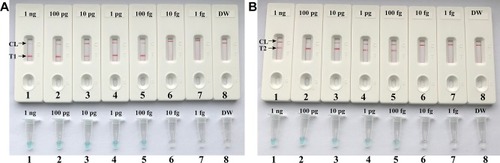
Figure 5 Visual detection of multiplex targets in a m-LAMP reaction. Two sets of LAMP primers targeting nuc and mecA genes were simultaneously added to a reaction vessel and the LoD of m-LAMP for simultaneously detecting S. aureus and identifying MRSA was analyzed using LFB. Biosensors 1, 2, 3, 4, 5, 6, 7 and 8 represent DNA levels of 1 ng (S. aureus ATCC 43300 templates), 100 pg (S. aureus ATCC 43300 templates), 10 pg (S. aureus ATCC 43300 templates), 1 pg (S. aureus ATCC 43300 templates), 100 fg (S. aureus ATCC 43300 templates), 10 fg (S. aureus ATCC 43300 templates), 1 fg (S. aureus ATCC 43300 templates) and negative control (DW). The LoD of m-LAMP assay for nuc and mecA detection was 100 fg per vessel.
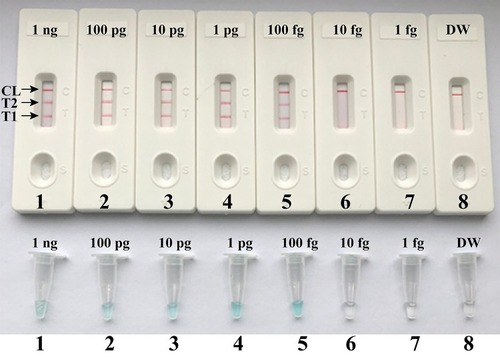
Figure 6 Optimal duration of time required for m-LAMP assay. Four different reaction times (A, 20 min; B, 30 min; C, 40 min; and D, 50 min) were tested and compared at 63 °C. Biosensors 1, 2, 3, and 4 represent DNA levels of 100 fg/μL (LoD level). The best sensitivity was seen when the amplification lasted for 50 min (C).
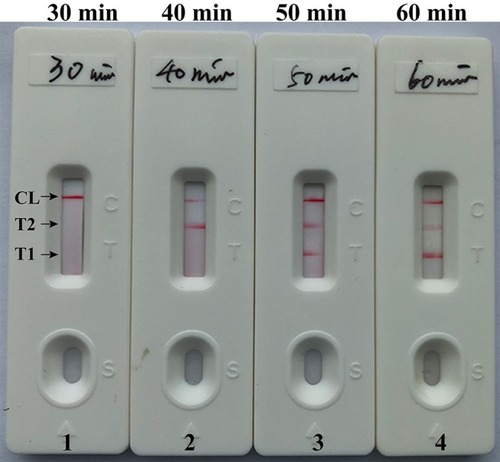
Figure 7 Analytical sensitivity of m-LAMP assay using different bacterial strains. The m-LAMP amplifications were performed using different genomic DNA templates and were monitored by means of visual format. Biosensor 1, MRSA (ATCC 43300); biosensor 2, MSSA (ATCC 25923); biosensor 3–17, biosensor 18, negative control (DW).
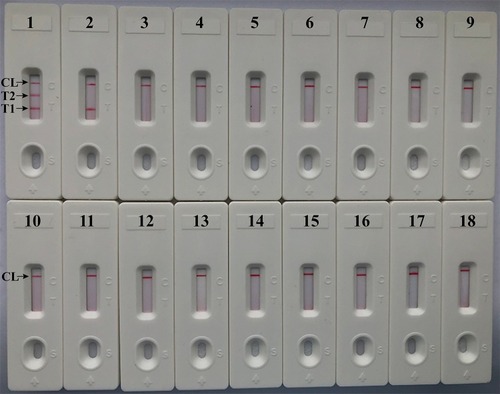
Table 3 Comparison of Conventional LAMP-LFB, Culture Biotechnical and PCR Methods for the Detection of S. Aureus in Sputum Samples of Human