Figures & data
Table 1 Antimicrobial Susceptibility Profile of A. baumannii Strains
Figure 1 Growth rate study. Growth rate of AB5075, ZJ06, LS01, and ATCC17978 strains were measured at (A) 37°C, (B) 30°C, (C) 42°C, (D) pH=4.5, (E) pH=5.5, and (F) Zn2+. Two-way analysis of variance (ANOVA) was used to assess differences between the means.
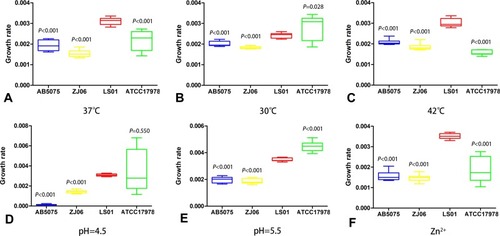
Figure 2 G. mellonera killing study. The percent survival of G. mellonera after infection with AB5075, ZJ06, LS01, and ATCC17978 was measured for 72 h after infection. Statistical significance was calculated using log rank test. The survival experiments were repeated three times (n=10 larvae per experimental group), and the most representative curves were presented.
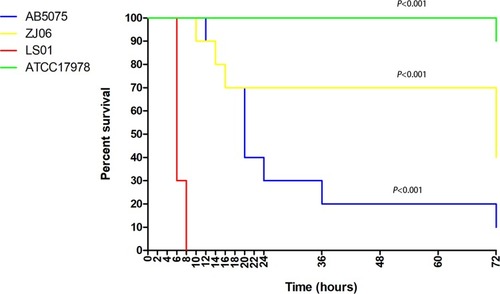
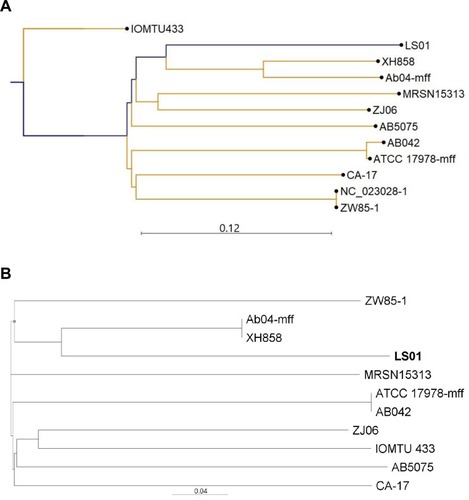
Figure 3 Phylogenetic analysis of the novel A. baumannii strain LS01. (A) K-mer tree; (B) single nuclear polymorphism (SNP) tree.