
Figures & data
Table 1 List of Primers and Expected Amplicon Size in This Study
Figure 1 Antimicrobial susceptibility patterns of K. pneumoniae, E. coli, and Enterobacter spp. isolates.
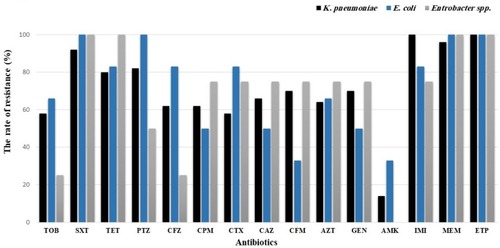
Figure 2 Distribution of imipenem and meropenem MICs in K. pneumoniae, E. coli, and Enterobacter spp. isolates.
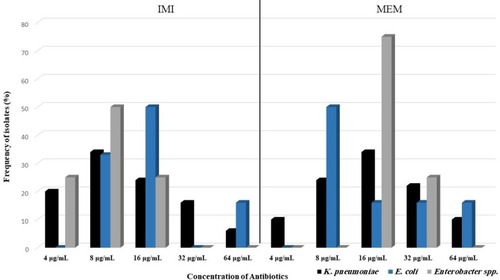
Table 2 The Susceptibility Testing Results in Carbapenemase-Producing Isolates
Table 3 The Frequency of Carbapenemase Genes and AmpC Overproduction in CRE Isolates