Figures & data
Table 1 MIC Values of Antimicrobials for C. freundii L91, Recipient Strain E. coli 600 and Transconjugant L91- E. coli 600
Figure 1 Genomic analyses of pIMP-4-L91 plasmid. (A) Comparison of the pIMP-4-L91plasmid sequence identified in isolate L91 with the blaIMP-4. This figure was generated using BRIG. (B) Genetic context of blaIMP-4 on pIMP-4-L91 and related plasmids. The GenBank accession numbers are KU051710.1, MH727565.1, KT989599.1, MF72962.1. Open reading frames (ORFs) are shown as arrows, and indicated according to their putative functions. Shared regions with high degree of sequence similarity are indicated by gray. Conjugal transfer associated genes were colored as pink; Red arrows point antibiotic resistance genes, and yellow arrows indicate the replication initiator. Hypothetical protein encoded genes are colored by grey.
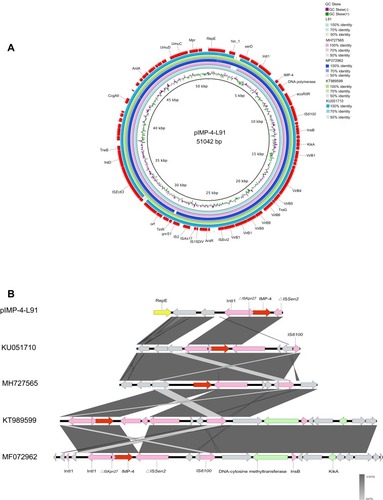
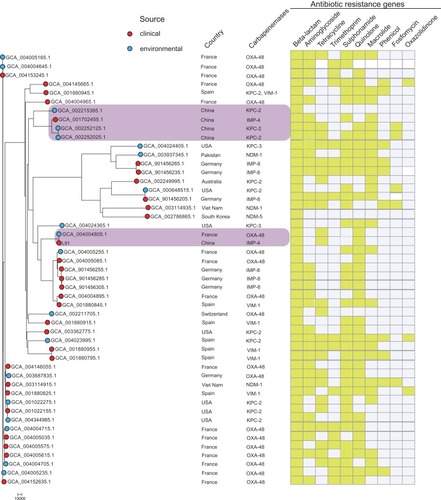
Figure 2 At the far left of the figure is the maximum likelihood core-gene phylogeny generated by kSNP. The red circle represents the isolate from the hospital and the blue circle represents the isolate from the environment. The figure also indicates which country the isolate is from and the carbapenemase gene carried. The gene sequence of the isolate was uploaded to Center of Genomic Epidemiology (http://www.genomicepidemiology.org/) to obtain antibiotic resistance gene type contained in the isolate. The heatmap is used to display the types of antibiotic resistance genes. Yellow indicates that the isolate carries such genes, and colorless means that the genes are not carried.