
Figures & data
Table 1 Clinical Background Information of blaNDM-5-Positive E. coli Isolates
Figure 1 Timeline of outbreak of NDM-5-producing E. coli in 8 infants in a Children’s hospital. Labels at the left side represent E. coli isolate IDs, including 2 (EC3 and EC30) obtained from the same patient. The different colors of the bars represent the different departments in which the patients were hospitalized (as shown at the top right), with the length of the bars representing the period of hospitalization. Four patients (for isolates EC10, EC8, EC27, and EC82) were hospitalized in 2 or more departments. The purple arrows indicate the dates of sampling.
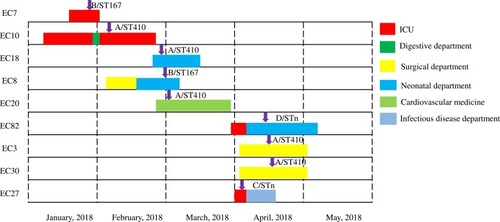
Table 2 Antimicrobial Susceptibility of 9 NDM-5-Producing E. coli Isolates
Figure 2 Dendrogram of 9 NDM-5-producing E. coli isolates based on pulsed-field gel electrophoresis (PFGE) patterns (indicated as A to D above the branches in the left) and their correlations with multilocus sequence typing (STs), replicon typing, and distribution of resistance genes. The dashed line in the left dendrogram represents 85% pattern similarity; isolates with >85% similarity were considered to have the same homogeneity. The red and blue squares indicate the presence and absence of the resistance genes indicated at the top, respectively.
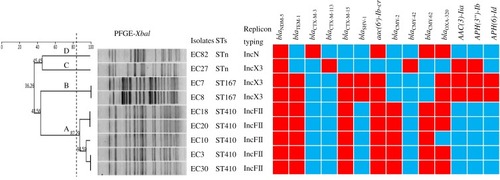
Table 3 Previously Reported E. coli Isolates Carrying NDM-5 and ST410