
Figures & data
Table 1 Characteristics of MRSA isolates from Patients Seen at the University Hospitals of Ahvaz, Iran
Table 2 Total Distribution of MRSA Among Different Clinical Specimens of Three Major Hospitals
Table 3 Results of Antimicrobial Resistance Tests by Disk Diffusion Method for MRSA
Table 4 Multidrug Resistance Patterns Among MRSA Isolates
Figure 1 Distribution of antibiotic resistance in MRSA with spa types.
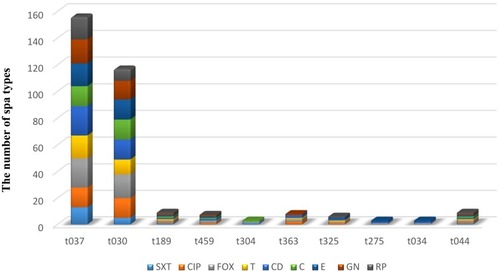
Figure 2 Comparison of different spa polymorphic region X HRM curves obtained from MRSA isolates. (A) Negative derivative of fluorescence over temperature (df/dt) plots displaying 10 HRM profiles. (B) Normalization data curve shows the decreasing fluorescence vs increasing temperature. (C) Difference graph demonstrating the accurate reproduction of eight spa HRM profiles in a run experiment. Isolates with difference plots that fall within the ±0.2 relative fluorescence unit (RFU) cutoffs were considered as the “same” type, while the isolates that lie outside of the ±0.2 RFU cutoffs were denoted as “different”.
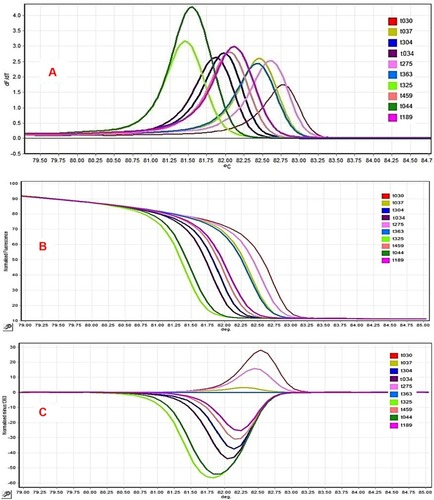
Table 5 HRM and Spa Sequence Types of the 50 MRSA Isolates, and the Frequencies in the Hospital of Origin