Figures & data
Table 1 The Mean Particle Size and Zeta Potential of CS NPs
Figure 1 Zetasizer showed that the mean size of CS NPs was mostly in the range of 414.9 nm (A). The zeta potential of CS NPs showed a good stability at 6.95 mV (B).
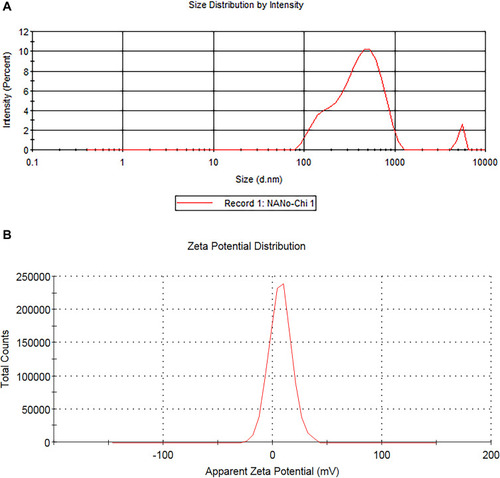
Figure 2 Physical properties of CS NPs and MSCs CM-CS NPs. SEM imaging of CS NPs (A). SEM imaging of MSCs CM-CS NPs (B).
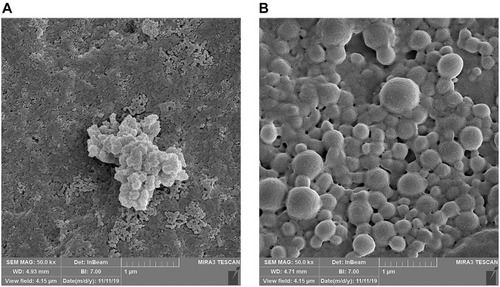
Figure 3 In vitro release of MSCs CM from MSCs CM-CS NPs at two different PH. Protein release rate in MSCs CM-CS NP increased at pH=7.2.
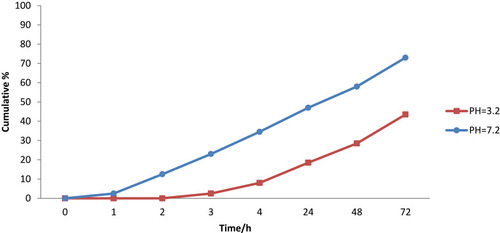
Table 2 Mean Inhibition Zone (mm) of Four Tested Groups Against MDR V. cholerae Strains
Figure 4 Mean inhibition zone (mm) against MDR V. cholerae strains: Caco2 supernatant: 0 mm (A); CS NPs: 22 mm (B); MSCs CM-CS NPs: 28 mm (C); and MSCs CM: 15mm (D).
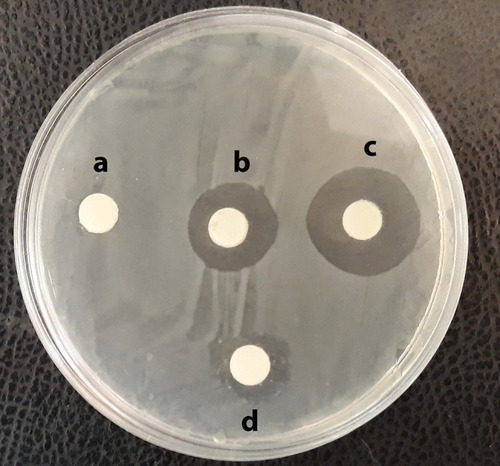
Figure 5 MSCs CM, CS NPs, and MSCs CM-CS NPs showed antimicrobial activity against MDR V. cholerae strains. Bacterial growth was assessed by CFU counts. Control group was V. cholerae strains alone. Bars are presented as mean of triplicate tests ± SD. ***P<0.0008 for control vs CS NPs; ***P<0.0002 for control vs MSC CM_CS NP; ***P< 0.0005 for MSCs CM vs MSCs CM-CS NPs; **P<0.0034 for MSCs CM vs CS NPs; *P<0.0158 for MSCs CM-CS NPs vs CS NPs; and *P<0.048 for control vs MSCs CM. Values showed the mean of triplicate tests ± SD. Data were analyzed by ANOVA test; Bonferroni.
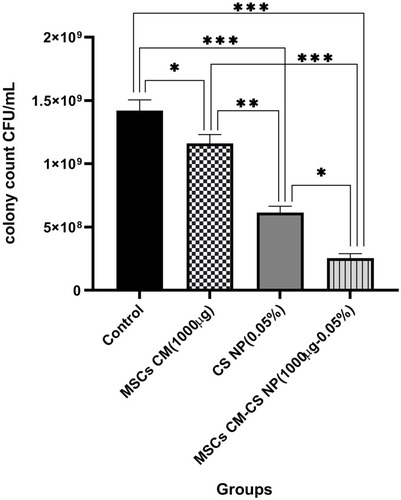
Table 3 Biofilm Formation of V. cholerae Strains Before and After the Exposure to Different Groups
Figure 6 Antibiofilm effect of different groups against MDR V. cholerae strains, including: 1) PBS; 2) MSCs CM + V. cholerae; 3) V. cholerae; 4) MSCs CM-CS NPs + V. cholerae; 5) V. cholerae + CS NP.
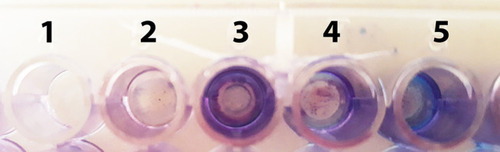
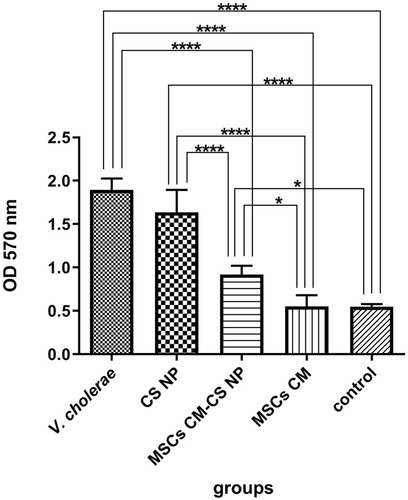
Figure 7 The inhibitory effects of different groups on biofilm formation of MDR V. cholerae strains. Bacterial suspension was incubated with each group. PBS was used as negative control. **** P< 0.0001 for all groups vs V. cholerae and CS NPs; *P<0.02 for MSCs CM-CS NPs vs control, and MSCs CM-CS NPs vs MSCs CM.