Figures & data
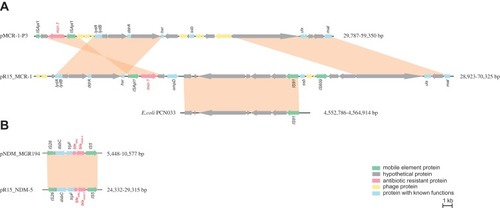
Figure 1 Lineal comparison of antimicrobial-resistant regions. (A) Comparison of the mcr-1 coding region of plasmid pR15_MCR-1 (MK256965) with plasmid pMCR-1-P3 (KX880944) and the chromosome of E. coli PCN033 (CP006632). (B) Comparison of the blaNDM-5 coding region of plasmids pR15_NDM-5 (MK256964) and pNDM_MGR194 (KF220657). Genes are portrayed by arrows and colored according to their functions.