Figures & data
Figure 1 Features of the plasma proteome dataset from label-free quantitative proteomics analysis. (A) The PCA plot was used to check and distinguish the 5278 peptide fragment ions between the two groups. A represents individuals in HIV-nonTB group and B denotes individuals in HIV-TB group; (B) a volcano plot of proteins in HIV-TB relative to HIV-nonTB group; (C) hierarchical cluster analysis of the 46 differentially expressed proteins.
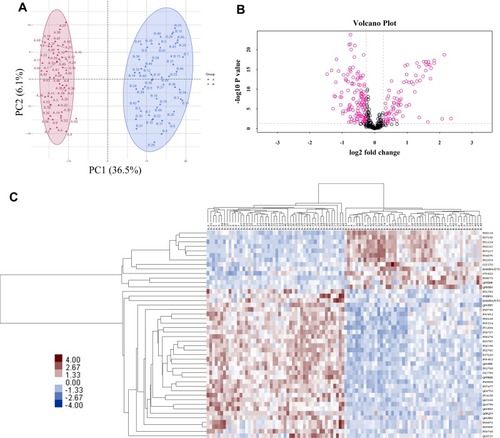
Figure 2 GO annotation terms of differentially expressed proteins at GO level 2.
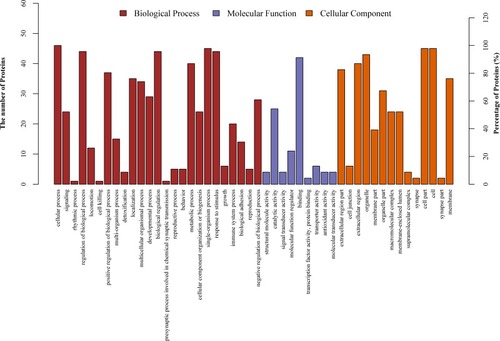
Figure 3 Significantly enriched GO terms for the differentially expressed proteins.
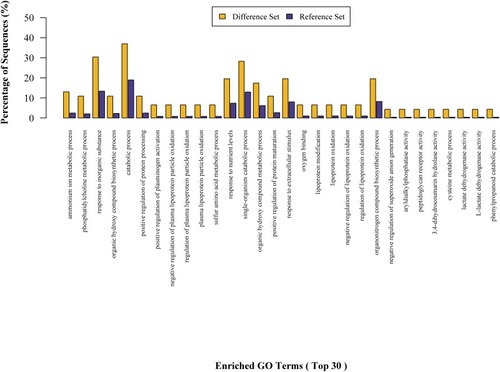
Figure 4 KEGG pathway enrichment analysis for the 46 differentially expressed proteins.
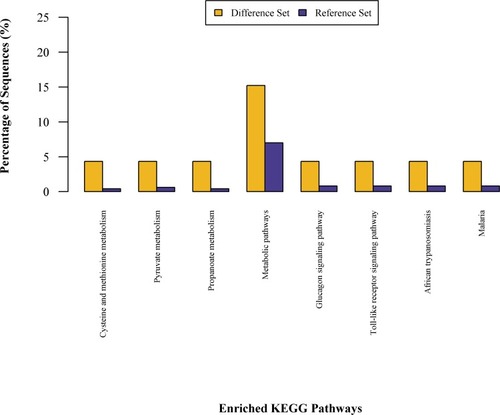
Figure 5 Levels of candidate biomarkers (mean±SEM) were measured by ELISA in plasma of HIV-TB (n = 50) and HIV-nonTB patients (n = 50).
Notes: Only 12 proteins are shown, and the details of all 20 proteins are listed in Table S2. The p-values were calculated with the two-tailed t-test. *p < 0.05; **p < 0.001.
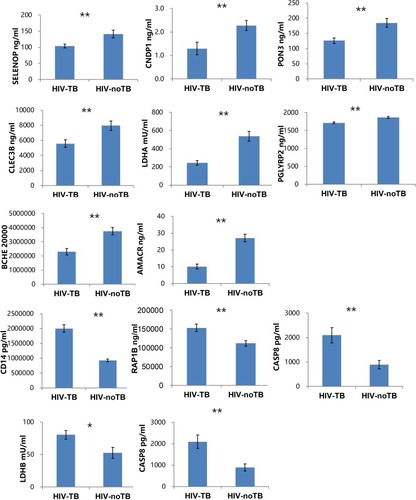
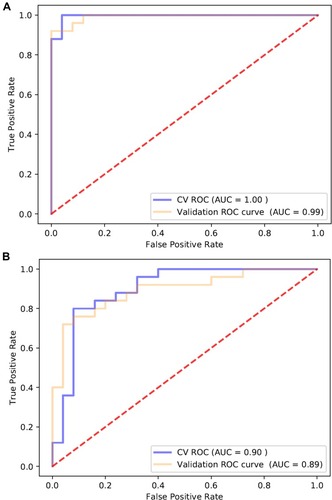
Figure 6 ROC curve analysis of AMACR, LDHB, and RAP1B combination using (A) proteomics data and (B) ELISA data to discriminate HIV-TB from HIV-nonTB individuals.