
Figures & data
Table 1 The Details of the Representative A. Caviae Strains Downloaded from Genbank
Figure 1 The phylogenetic tree was constructed by aligning the core genome of Aeromonas caviae SCAc2001 strain with 15 other representative A. caviae strains.
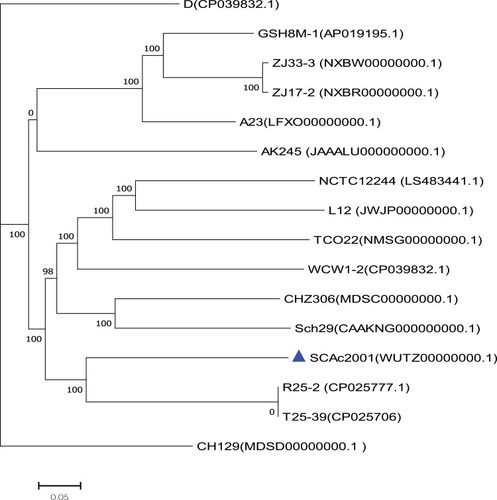
Table 2 Distribution of the Resistance Genes in Aeromonas caviae SCAc2001
Table 3 Distribution of the Virulence Factors in Aeromonas caviae Strain SCAc2001a
Table 4 Distribution of the PHI Genes in Aeromonas caviae Strain SCAc2001a
Table 5 Overall Features of the Aeromonas caviae SCAc2001 Genomic Islands and Prophages
Table 6 Characterization of Secondary Metabolism Products' Coding Clusters