
Figures & data
Table 1 Sociodemographic and Baseline Clinical Characteristics of VL Patients at the University of Gondar Hospital, 2019 (n=586)
Figure 1 Kaplan–Meier failure curves for some of the variables among the cohort of VL patients at the University of Gondar Hospital, 2019.
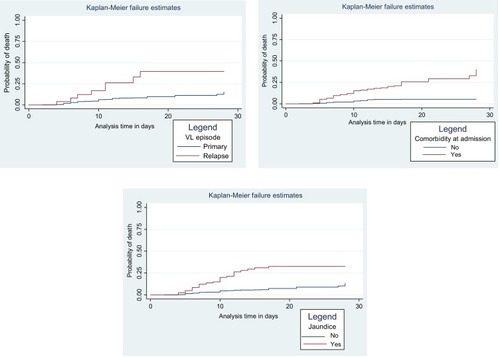
Figure 2 Proportional hazard plot for some of the variables among the cohort of VL patients at the University of Gondar Hospital, 2019.
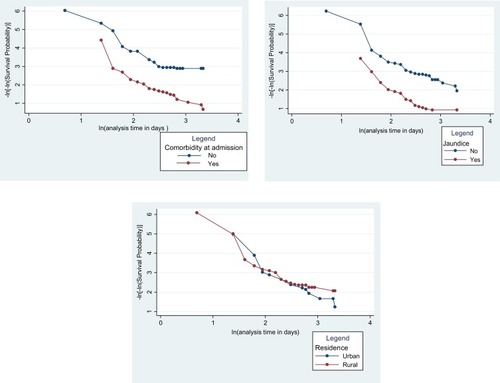
Table 2 Proportional Hazard Assumption Test for the Study on Incidence of Mortality and Its Predictors Among VL Patients at the University of Gondar Hospital, 2019
Table 3 Multivariable Stratified Cox Regression Analysis for Incidence of Mortality Among VL Patients at the University of Gondar Hospital, 2019